
Case Study
How USC Consulting Group Reduced Overfill and Saved a Leading Candy Manufacturer $1.2M with the Help of Minitab Statistical Software ›
Analyze data, uncover trends, and solve complex business challenges with the analytics engine at the core of Minitab Solution Center.
Harness the power of statistics
Data is everywhere, but are you truly taking advantage of yours? Minitab Statistical Software can look at current and past data to discover trends, find and predict patterns, uncover hidden relationships between variables, and create stunning visualizations to tackle even the most daunting challenges and opportunities.
With powerful statistics, industry-leading data analytics, and dynamic visualizations on your side, the possibilities are endless.
Discover
Regardless of statistical background, Minitab empowers all parts of an organization to predict better outcomes, design better products, and improve processes to generate higher revenues and reduce costs. Only Minitab offers a unique, integrated approach by providing software and services that drive business excellence from anywhere with the cloud.
Key statistical tests include t tests, one and two proportions, normality test, chi-square, and equivalence tests.


Predict
Access modern data analysis and explore your data even further with our advanced analytics. Skillfully predict, compare alternatives, and forecast your business with ease using our revolutionary predictive analytics techniques.
Use classical methods in Minitab Statistical Software, integrate with open-source languages R or Python, or boost your capabilities further with machine learning algorithms like Classification and Regression Trees (CART®), TreeNet® and Random Forests®, now available in Minitab's Predictive Analytics Module.
Achieve
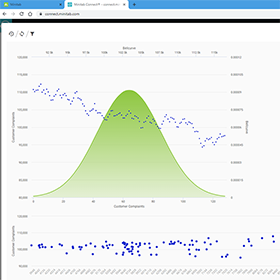
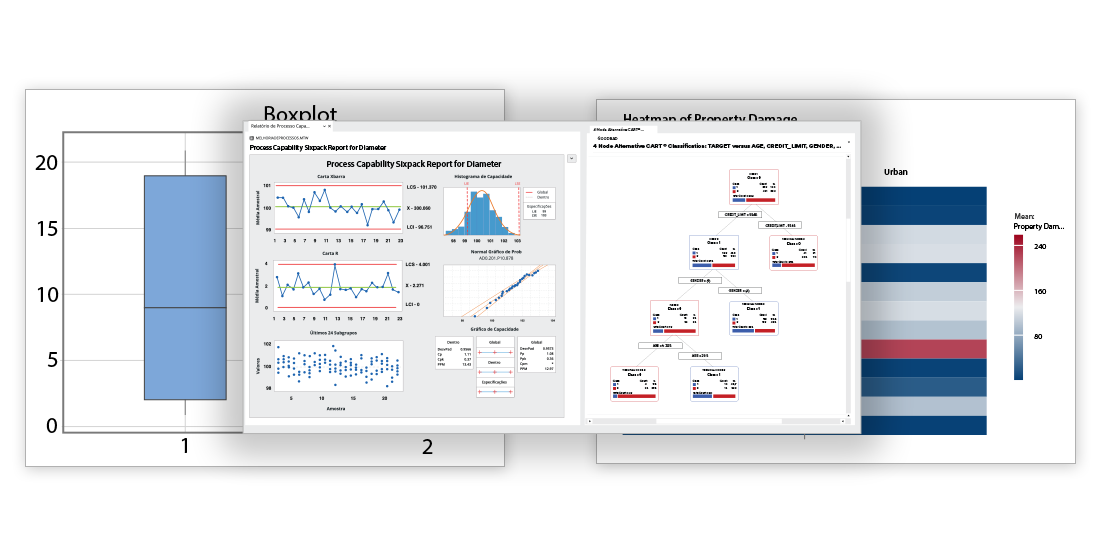
Seeing is believing. Visualizations are critical to accurately communicate findings and achievements. Deciding which graph best displays your data and supports your analysis is fast and easy with Graph Builder.
Our new interactive tool with an easy-to-browse gallery lets you view and explore multiple graph options without re-running your analysis. Using the same selection of data each time, Graph Builder seamlessly updates from bar charts to correlograms to heat maps and more, so you can focus on choosing the best visual for your insights.

See How Our Clients Use Minitab Statistical Software
Partner with Minitab on your analytics journey
Measurement System Analysis
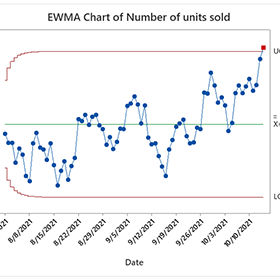
Control Charts
Capability Analysis
Acceptance Sampling
Tolerance Intervals
Distribution Analysis
Test Plans
Warranty Analysis
Reparable Systems Analysis
Regression with Life Data
Probit Analysis
Design of Experiments (DOE)
Power and Sample Size
Correlation
Statistical Modeling
Time Series Analytics
Visualizations
Multivariate Methods
Chi-Square Test for Association
Stage 1: Process Design
Stage 2: Process Qualification
Stage 3: Continued Process Validation
Get the most out of Minitab with these resources.
Grow Your Skills
Access analytical training and education from an easy-to-use web-based platform.
Gain insight into your data and improve your abilities with courses guided by expert statisticians.
Let our statistical consultants help you solve your quality improvement problems.
Ready to discover Minitab Statistical Software?
Start your Solutions Analytics™ journey today with a free trial of select Minitab products! Access all the powerful capabilities, latest enhancements, and new features that Minitab has to offer with each trial.
Access the help you need to use our software from representatives who are knowledgeable in statistics, quality improvement, and computer systems.
You are now leaving minitab.com.
Click Continue to proceed to: