Blog Article
Top 3 Root Cause Analysis Tools to Boost Customer Satisfaction ›

Visual Business Tools
Are you tired of needing a handful of software solutions to brainstorm. Build flow charts for processes, or organizational charts, create value stream maps that identify key areas of value to improve? We were, too. Meet our diagramming and mapping solution that does it all!
Learn how Minitab provides a one-stop-shop for all your diagramming and mind-mapping needs.
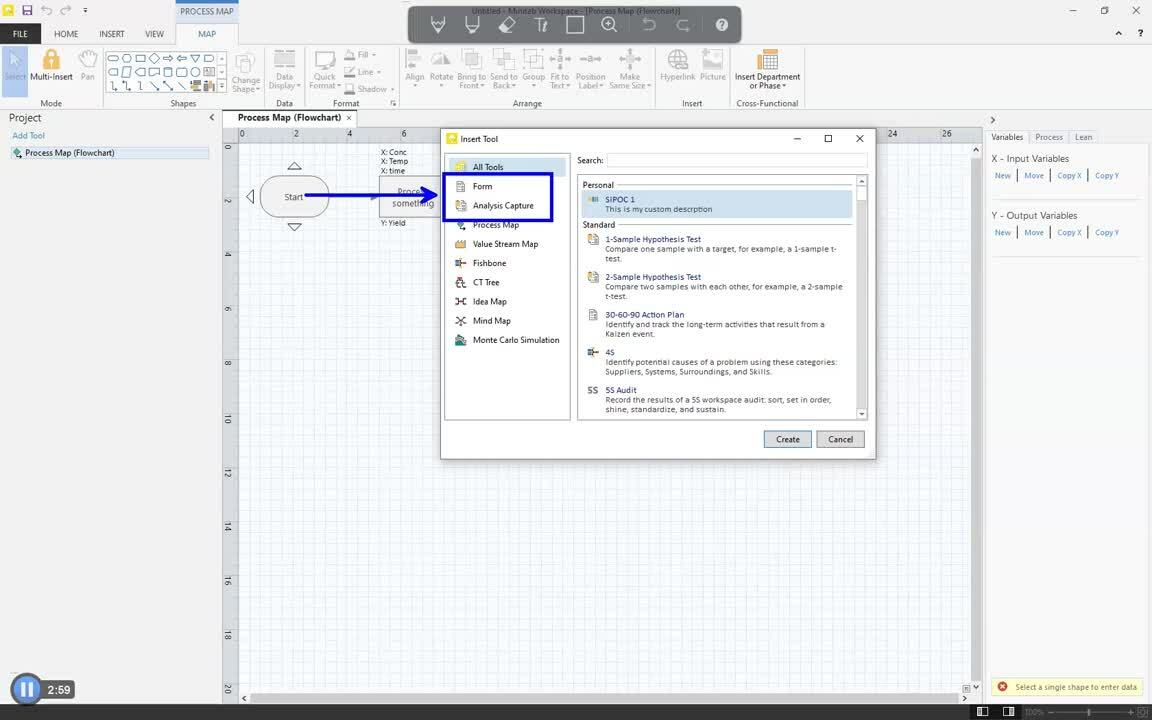
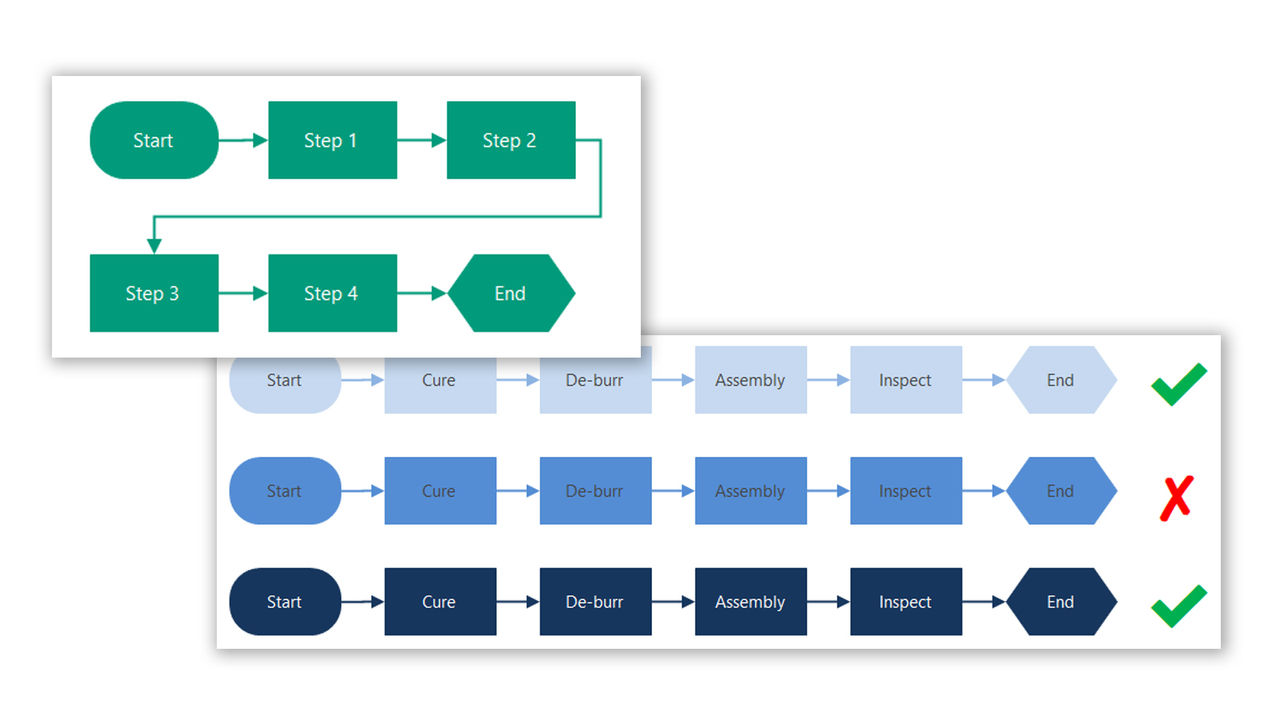
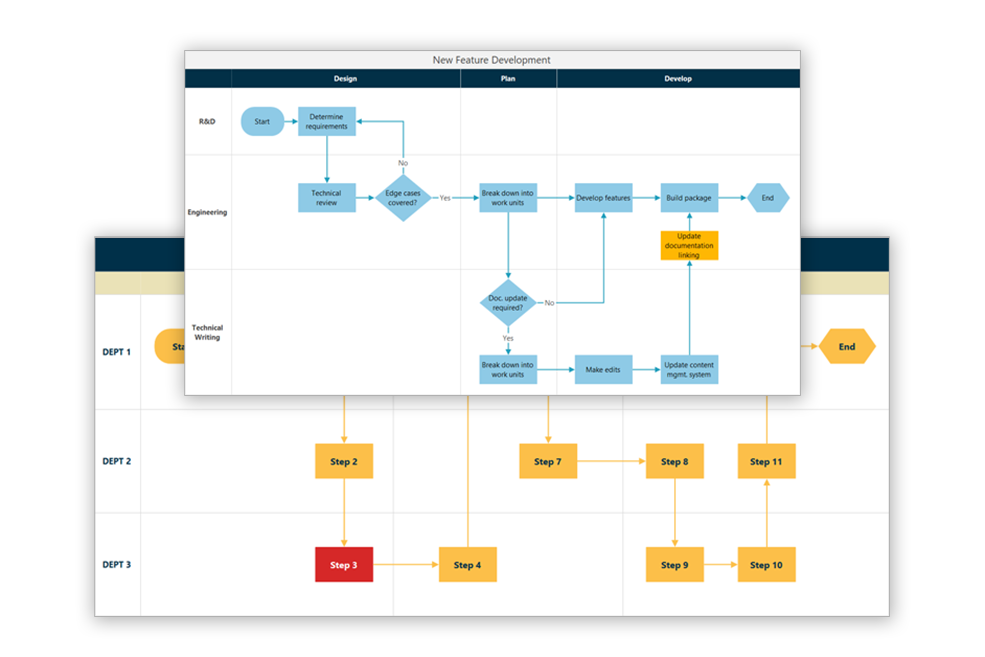
Process Mapping
Learn how to build the best process maps to identify areas of improvement.
Mind Mapping & Brainstorming Tools
Capture and organize your ideas to help you solve your problems.
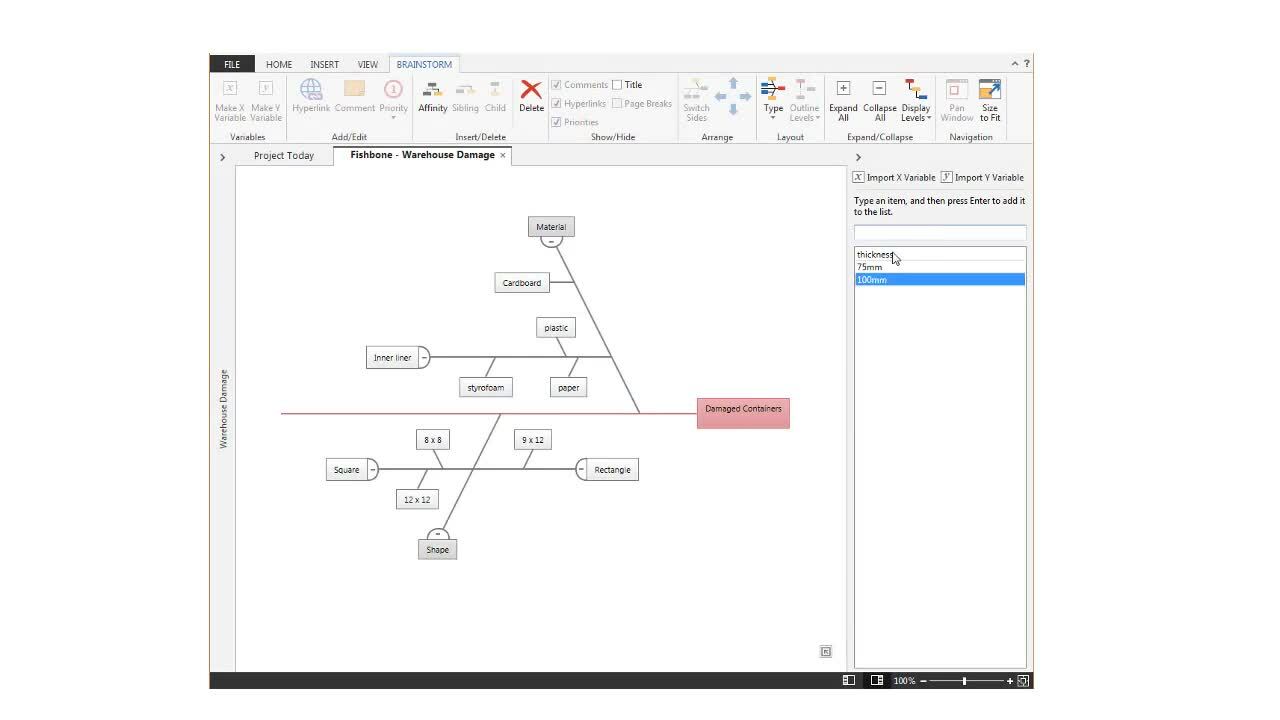
See a quick demonstration of Minitab’s Mind-Mapping and Brainstorming tools in action.
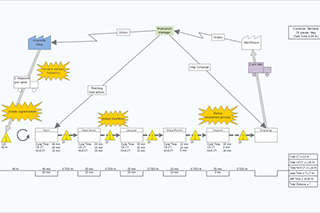
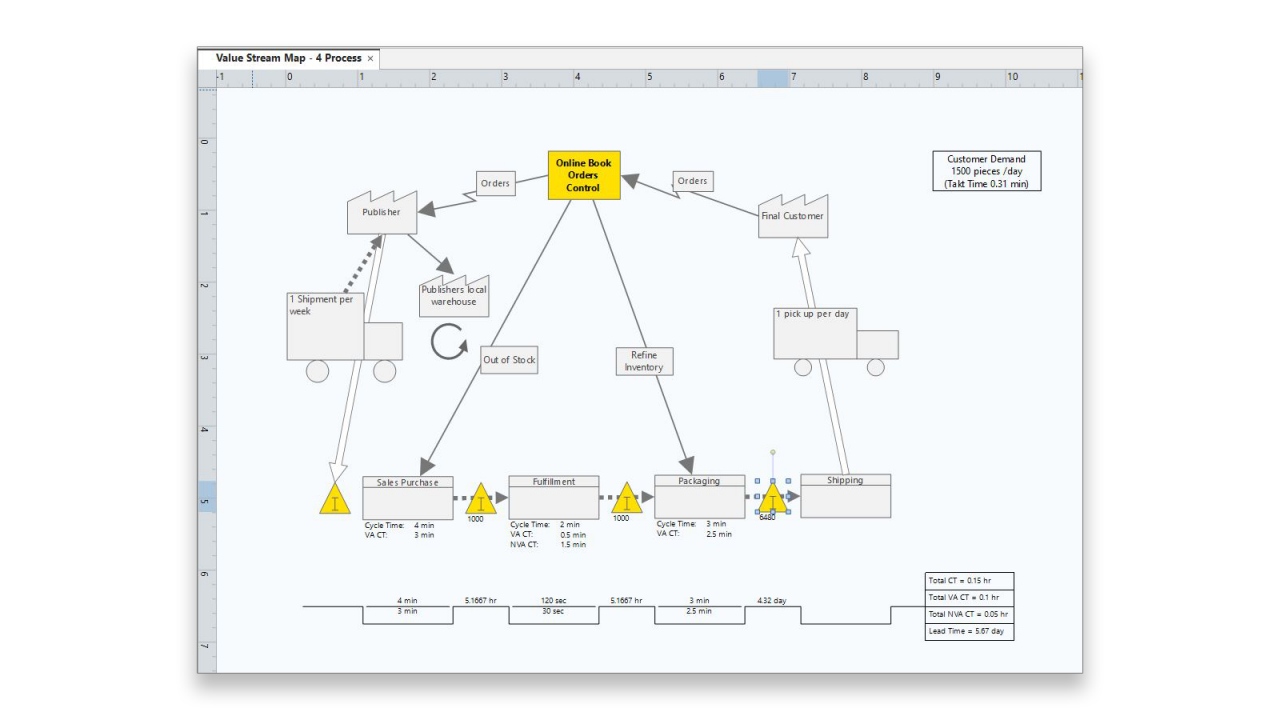
Value Stream Mapping
Value stream mapping is a cornerstone of the Lean process improvement methodology, and also is a recognized tool used in Six Sigma. A value stream map illustrates the flow of materials and information as a product or service moves through a process. Creating a “current state” value stream map can help you identify waste and also makes it easier to envision an improved state for process in the future.
A One-Stop Shop for All the Visual Tools You Need
Most diagramming and mind mapping solutions support one use case. If you want to brainstorm, use a Mind Map. Need an org chart? There’s software for that. Want to build a flow chart? Invest in yet another application. The reality is you want to do all these things! So ,you’re presented with one of two choices: purchase multiple solutions from different vendors, or try to adapt office solutions to accomplish all the above. Until now.
With Minitab’s Diagramming and Mind Mapping Solutions, you get all the tools you need. After all, isn’t that what a solution is supposed to be? Want to brainstorm? Leverage one of the many tools Minitab offers. Different mapping techniques provide versatility and flexibility to help you create the flow chart that best suits your needs. Additionally, Minitab’s ecosystem offers a variety of useful tools, templates, data access, analysis, and even project management solutions, so you can put your diagrams into action!
We built these solutions because we’ve been diagramming solutions and mapping ideas for over 50 years. We understand your needs and limitations. By offering a variety of diagramming tools and templates, we can help you exceed those expectations!
Stella J.
Chief Information Officer
Our Customers
Nicolas B.
Managing Director
Henri H
Data Analyst
You are now leaving minitab.com.
Click Continue to proceed to: