Webinar
Beyond Ordinary Business Intelligence Dashboards ›
Go Beyond Business Intelligence with Minitab

Beyond Business Analytics
Make intelligent, data-driven business decisions with the help of Minitab! Our solutions automate insights to quickly inform you of risks and opportunities. And the data visualizations can help you spot trends and problem areas. We’re here to help you make predictions and stay ahead of the market and your competition.

Beyond BI
Business is evolving, and so should your dashboards. Meet Live Analytics, powered by Minitab®, our latest solution built to empower all data professionals with the ability to easily create and incorporate statistical analysis into powerful visualizations. Join us to uncover how automated, real-time analytics can help you deliver more advanced analyses on a convenient and shareable platform.
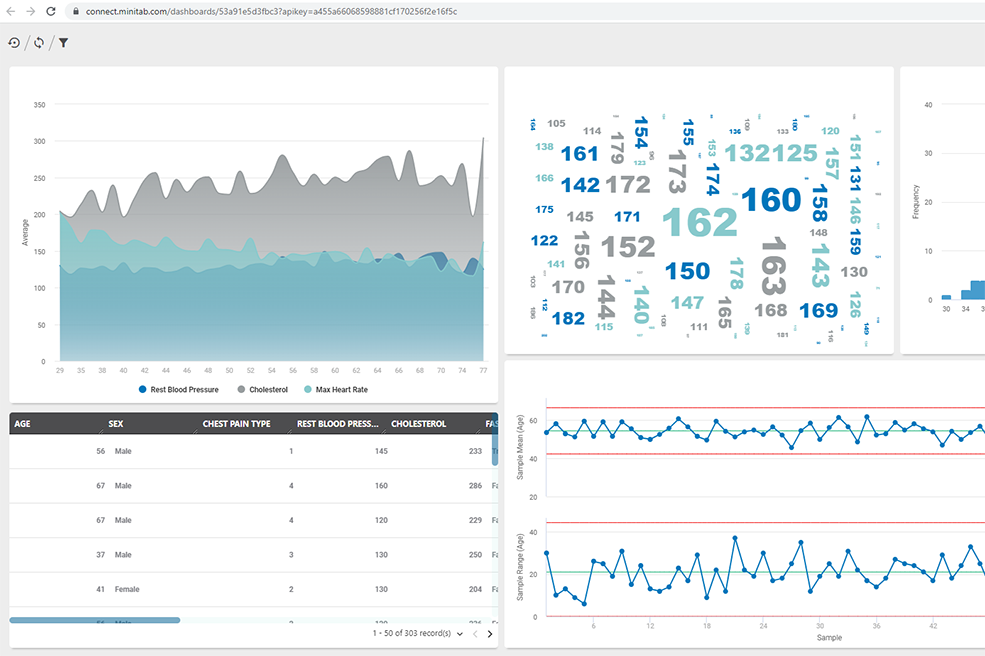
Instantly Build Graphs and Visualizations
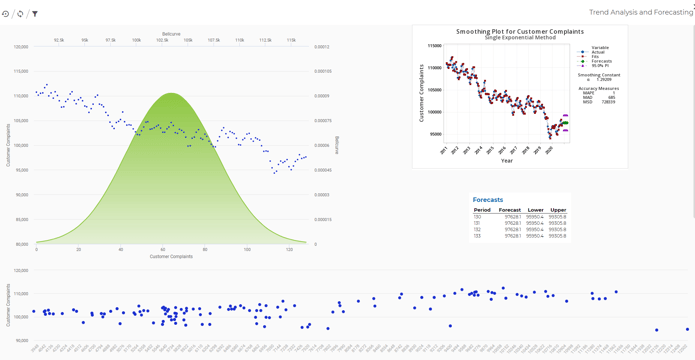
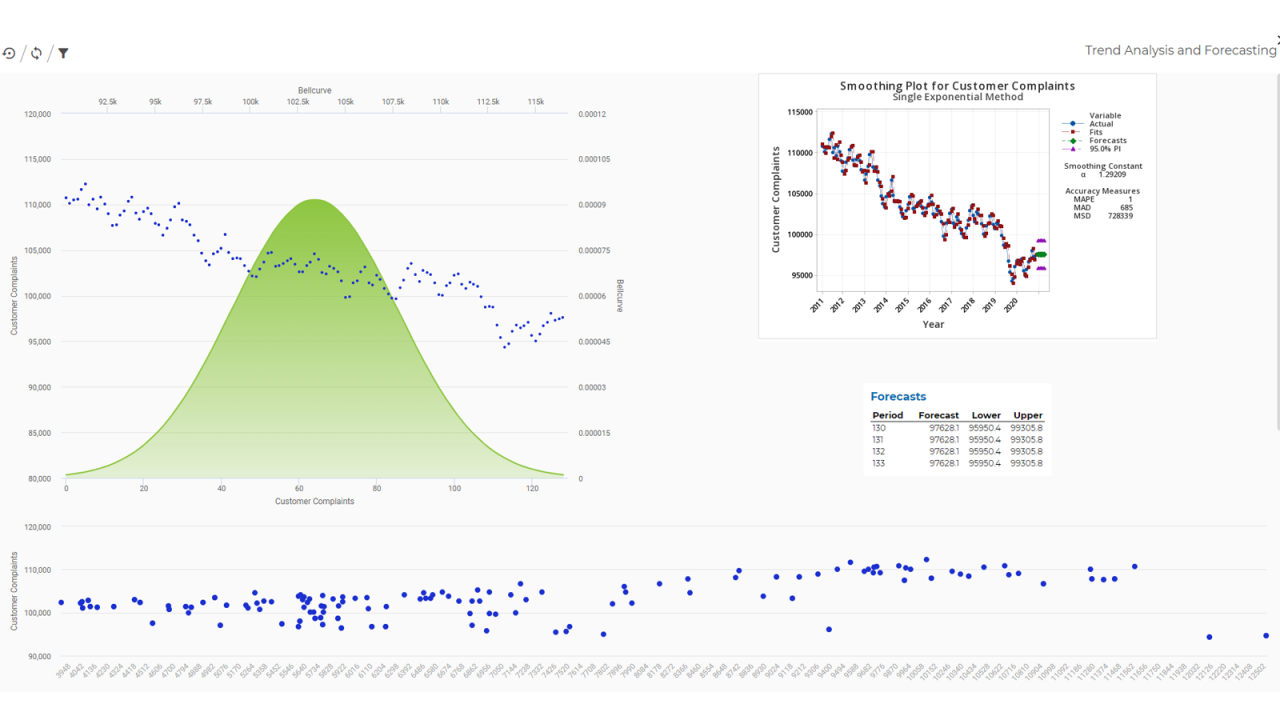
Seeing is believing. Visualizations are critical to accurately communicate findings and achievements. Deciding which graph best displays your data and supports your analysis is fast and easy with Graph Builder.
Data Integration
Learn how Minitab helped a Fortune 50 telecom company get a complete view of its customers’ service needs, enabling the enterprise to more efficiently solve customers’ problems through digital self-service. With a 360-view of its users’ troubleshooting journeys, the client identified areas where online support content could be improved to empower customers to easily resolve issues on their own, saving more than $2.3 million in call center costs.

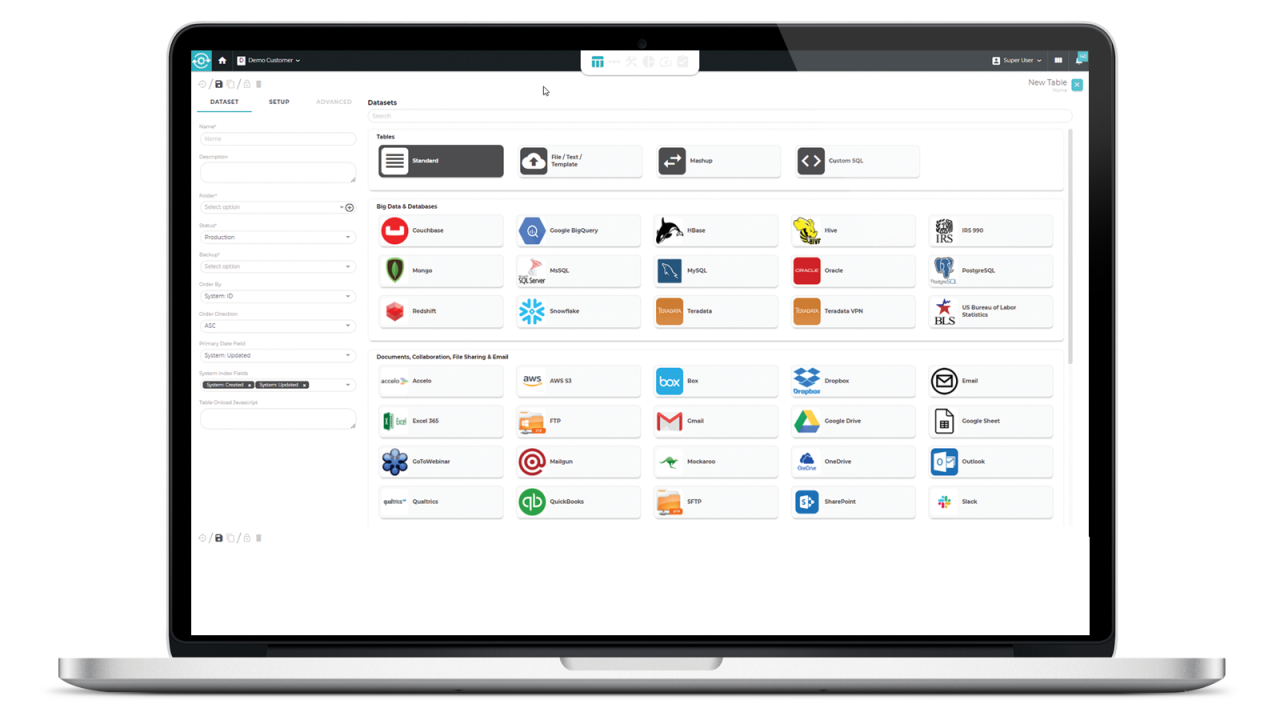
Data Prep
Minitab Connect provides analysts with the tools to design data prep workflows and run results on data prep workflows instantly, without switching between applications. Within Minitab Connect, the Prep tool provides self-service data preparation to allow data users with varying technical skills to enrich, fix, aggregate, and explore their data for analysis. The Prep tool interface makes it easy to filter, access statistical functions, set conditional formatting, and join or blend data using a dynamic visual environment without risking data quality, integrity, or security.
Go Beyond Business Intelligence
Basic business intelligence tools give you just that, basic intelligence. If you’re ready to dive deeper into analytics but are not a data scientist or a programmer—you've found the right partner! Minitab knows you need a solution that allows you to access your data, without the help of IT. And our solutions can empower you to use advanced analytics, while also allowing you to easily share automated insights with your peers and leadership (in an easy-to-understand way!).
Built on our proprietary statistical and machine learning driven engine, only Minitab allows you to go beyond business intelligence to gain deeper insights. Other analysts use basic charts, Minitab uses statistical methods and advanced visualizations to definitively highlight insights that everyone can understand. While other solutions require you to regularly check their dashboards, Minitab lets you set alarms around key indicators. And that means you can focus on doing your job, not constantly updating your data.
We started providing business intelligence more than 50 years ago. Over the years, our competitors have focused on creating pretty pictures, which then require you to rely on open source or third-party analytics to enable decision making. Minitab not only provides state-of-the-art visualizations, we also have our own proprietary analytics that have been refined for decades!
OUR CUSTOMERS
Carrie B
Insurance Broker
OUR CUSTOMERS
Henri H
Data analyst
You are now leaving minitab.com.
Click Continue to proceed to: