

Process Simulation Analysis Module
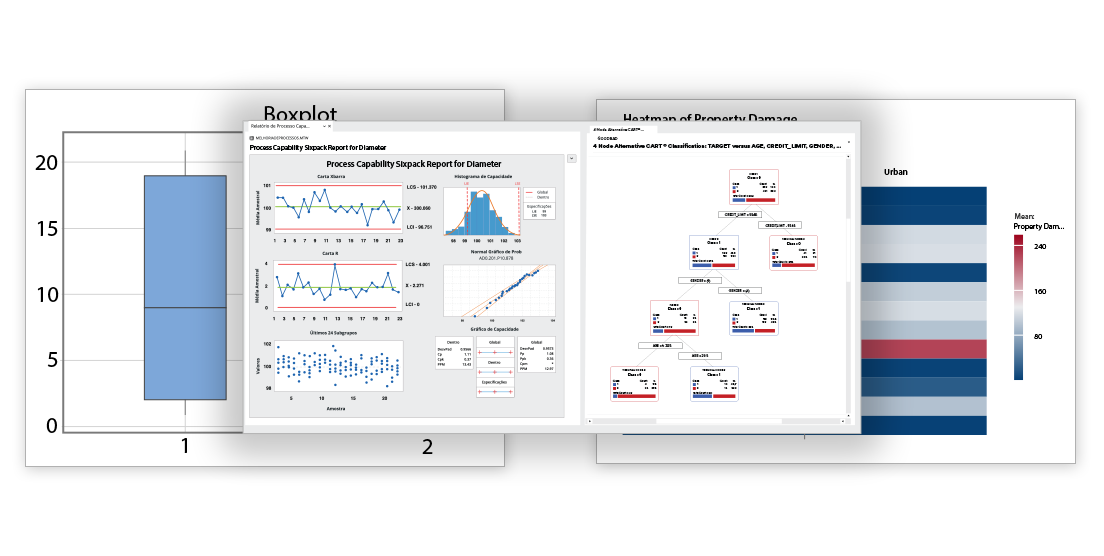
Leverage the power of process analysis to uncover inefficiencies, reduce variation, and drive continuous improvement with Minitab’s Process Simulation Analysis Module.
- Process Simulation Analysis Module Overview
- Explore Simulation Results
- Compare Variation Across Scenarios
- Design of Experiments
- On-Demand Assistance
Process Simulation Analysis Module Overview
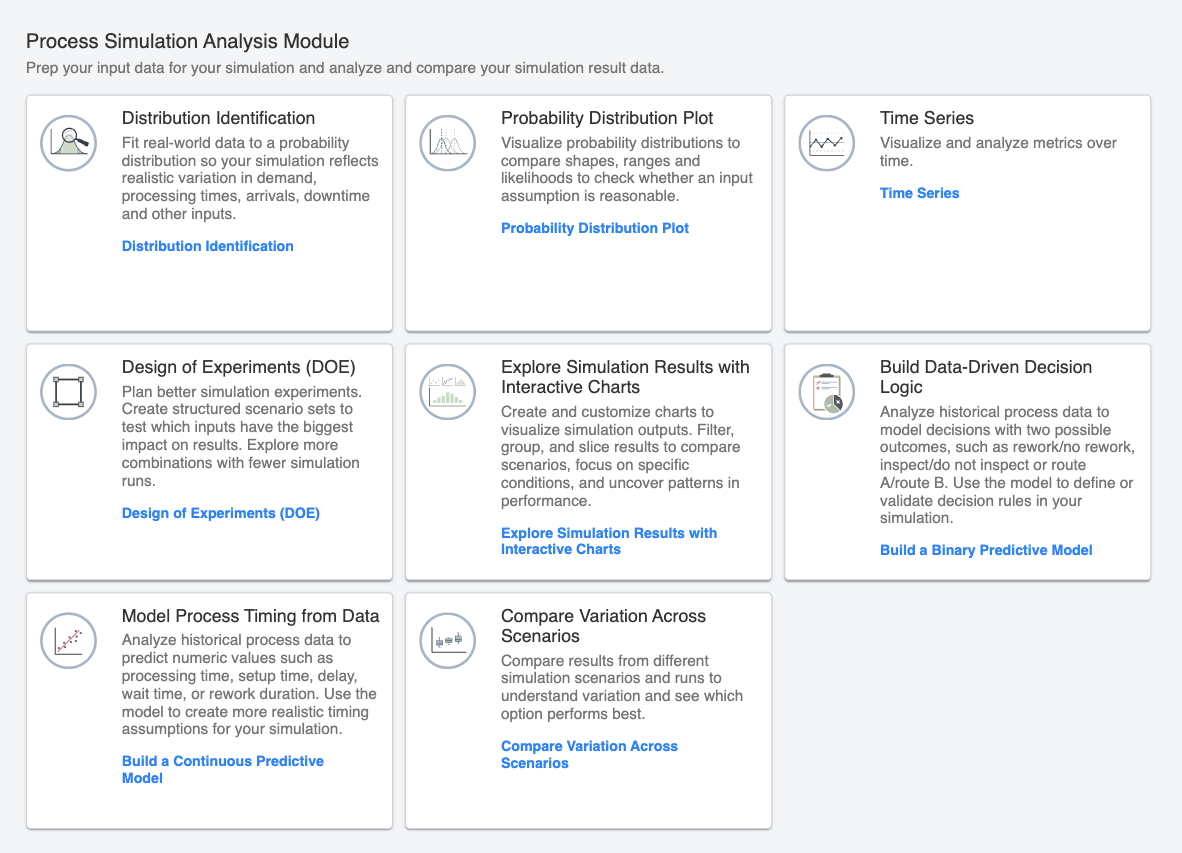
Minitab’s Process Simulation Analysis Module helps you analyze, visualize, and compare simulation results. Use real-world process data to identify realistic assumptions, model process behavior, explore scenario outcomes, and understand how variation impacts performance.
The module brings together tools for distribution identification, probability distribution plots, time series analysis, design of experiments, interactive charts, predictive modeling, and scenario comparison, helping you turn simulation data into actionable insight.
Explore Simulation Results
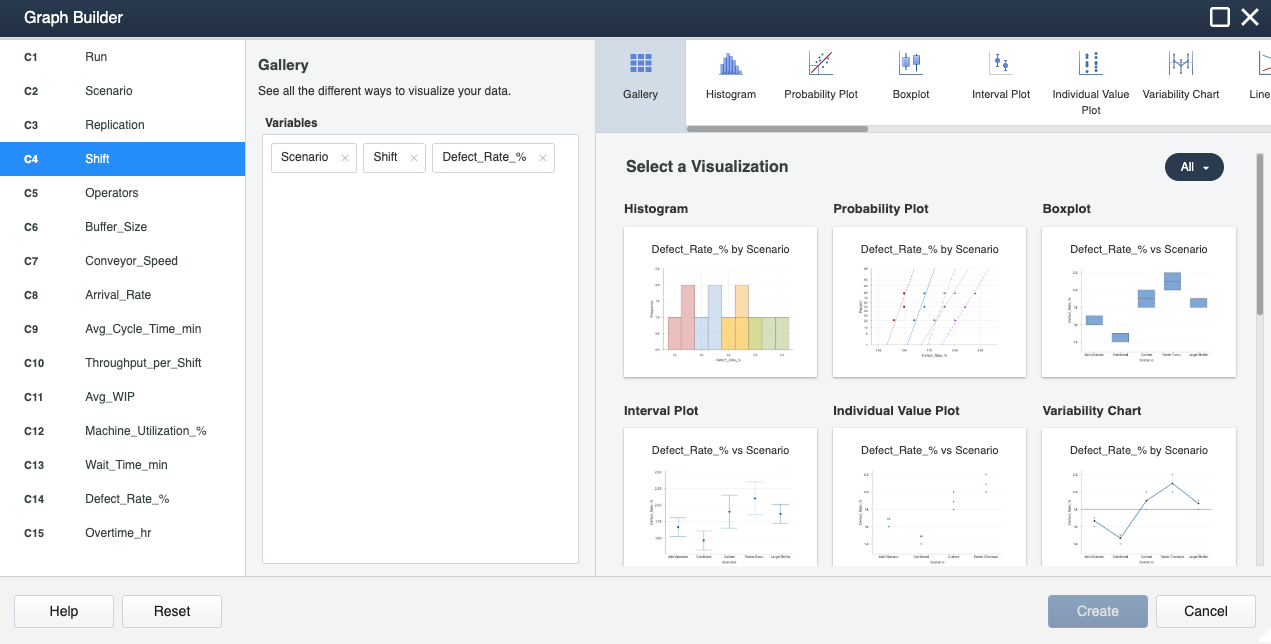
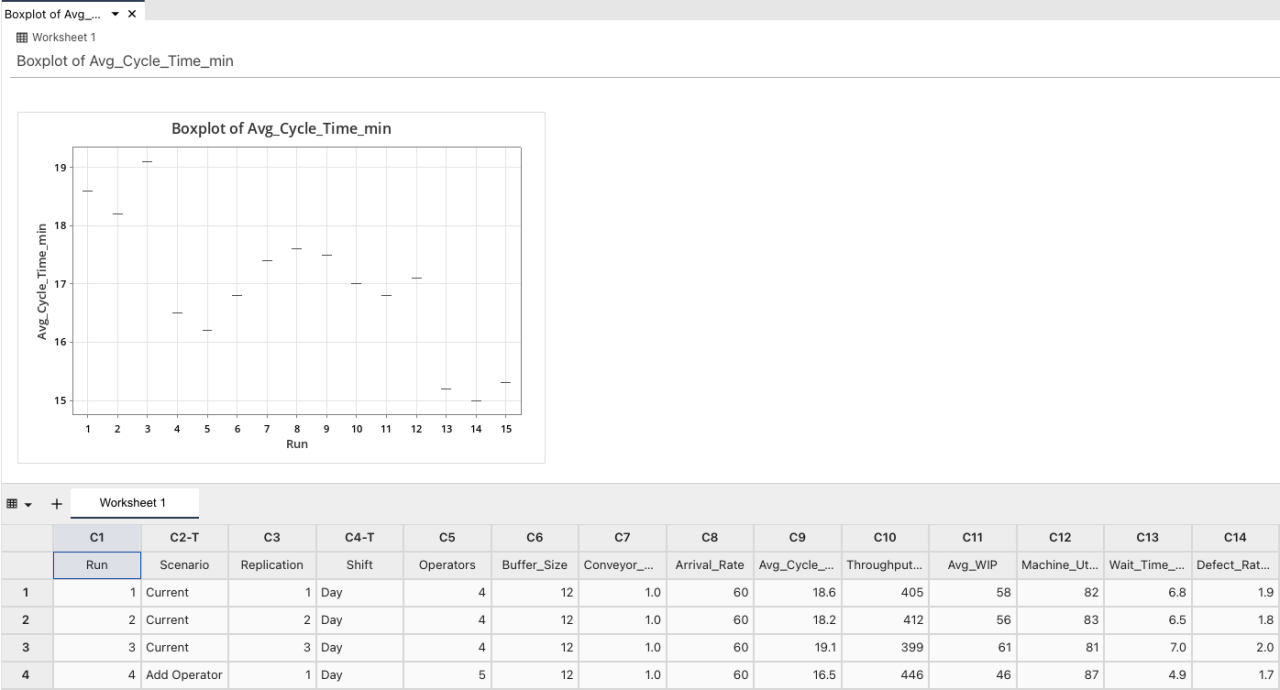
Create and customize interactive charts to visualize simulation output. Filter, group, and slice results to compare scenarios, focus on specific conditions, and uncover patterns that help explain process performance.
Compare Variation Across Scenarios
Compare results from different simulation scenarios and runs to understand how variation changes across process options. Identify which scenario performs best and evaluate the consistency of expected outcomes before making changes.
Design of Experiments
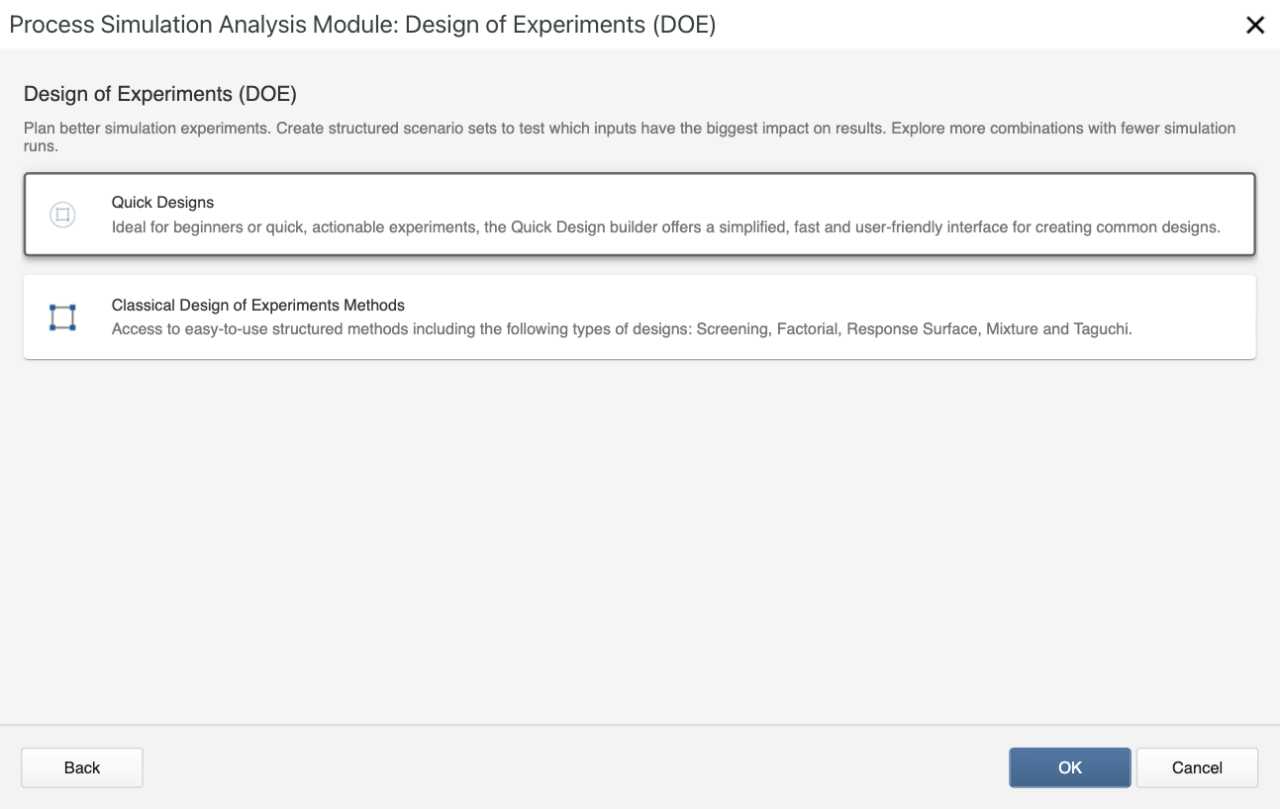
Create a designed experiment to systematically investigate the process or product variables that affect performance and quality. Use DOE to understand which inputs matter most and support more informed decisions about process improvement.
On-Demand Assistance
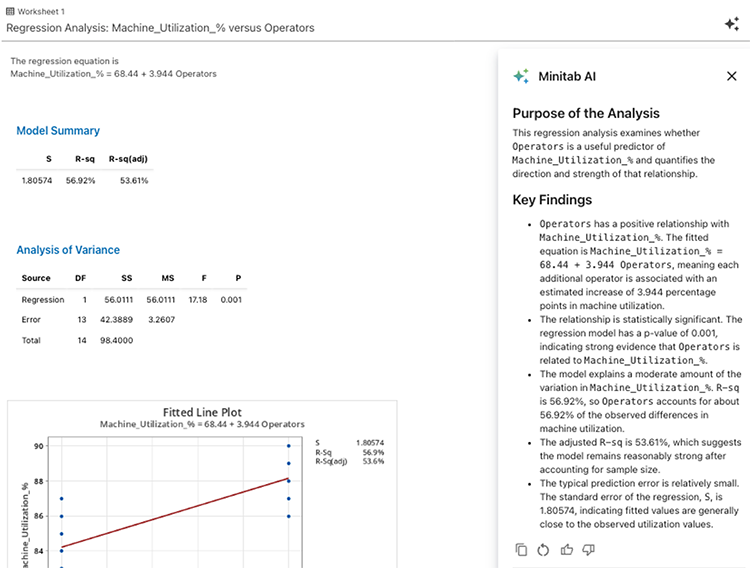
Minitab is with you throughout your simulation analysis. Guided tools and built-in resources help you prepare data, choose appropriate analyses, interpret results, and compare scenarios with confidence.