With a branch network of more than 12,000 locations throughout the United States and Canada and nearly 7 million clients worldwide, Edward Jones knows a thing or two about providing high-quality customer service.
The full-service financial brokerage firm, which is headquartered in St. Louis, Missouri, has steadily increased its workforce of financial advisors to keep up with customer demand. The firm hopes to have 20,000 financial advisors on board by 2020. Given its current growth—and plans for future expansion—the firm wanted to ensure its world-class service continues to exceed customers’ expectations. Armed with Lean Six Sigma tactics and the statistical tools in Minitab, the business process improvement team at Edward Jones set out to assess how the firm could continue to meet its high customer service standards in the midst of increasing service demands.
The Challenge
The service division at Edward Jones focuses on giving customers who call their service center not just timely, accurate, and professional responses, but also care that is friendly and customized to each client. But with a rapidly increasing volume of incoming calls, Edward Jones faced a challenge: how would their current staff of service associates meet the rising service demands while maintaining, or even surpassing, the firm’s current high standards for customer service?

With the help of Minitab, a project team at Edward Jones performed a DOE to find the optimal mix of factors to improve customer service processes in its call centers.
“We faced questions such as, is it better to cross-train service associates on multiple skill areas? And how can we optimize the average speed of an answer?” says Rod Toro, Master Black Belt and business process improvement manager at Edwards Jones. “We looked to data analysis and Minitab to help us answer these questions.”
How Minitab Helped
Toro and the project team had a key breakthrough when they were thinking through how to begin this Lean Six Sigma project.
“First we started thinking about how we could help each associate do their job better in each interaction with the customer,” says Toro. “Then we instead shifted our focus to improving the overall process and all the aspects that make up a service call—from training new associates, to each phase of the actual call, and any after-call work.”
This shift in focus allowed the team to start thinking about improvement in terms of the process as a whole. They began to see a process that was repeatable, standardized, and predictable—a process that could be optimized.
“We knew we needed to identify the metrics to distinguish the right associate for the right skill, as well as streamlining the workflow in a more efficient and meaningful way,” Toro says. “By assigning the right person to the right skills, we’re reducing average handle time and thereby improving average speed to answer, and the overall customer experience.”
At the start of the project, all associates were trained on multiple skills, with all skills receiving the same staffing priority. In addition, resource changes and additions were made frequently without taking the impacts into account. The team knew they could improve from where they were starting from. “We had the opportunity to optimize associate capacity to balance the department performance across all phone skills,” Toro says.
So how would they do it? Enter the Design of Experiments (DOE) tools in Minitab.
In statistics, DOE refers to the creation of a series of experimental runs, or tests, that provide insight into how multiple variables affect an outcome, or response. In a designed experiment, project teams can change more than one factor at a time, and then use statistical analysis to determine what factors are important and identify the optimum levels for these factors.
The most common application for DOE is in manufacturing environments, where the method is used to find machine settings that will produce optimal process performance at the lowest cost.
“Typically, you hear of DOE and other statistical methods being utilized in manufacturing, but there’s really no limit to where the technique can be employed,” says Toro. “Once we understood the principles of DOE, we realized we could also apply it to our service processes.”
Toro and the team selected four key factors—associate rating, after-call work, shift hours, and training hours—and used Minitab to design a 2-level factorial experiment. After collecting and analyzing the data, they were able to use the Minitab output to assess the best mix of each of the four key factors.
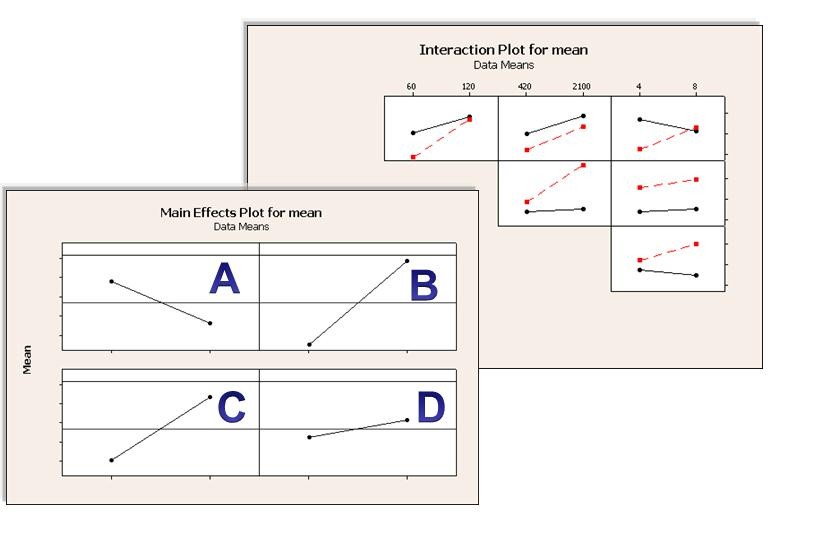
Main effects and interaction plots for the average overall performance indicated that cross-training associates so they were well-versed on all skills was actually a detriment. In addition, main effects and interaction plots for the standard deviation revealed that consistency was mainly attributable to associates with a higher skill level.
“We learned that cross-training all the associates on all skills wasn’t effective. Instead, we found that allowing them to focus on their best skills enabled them to perform better,” says Toro. “This was our ‘Aha’ moment.”
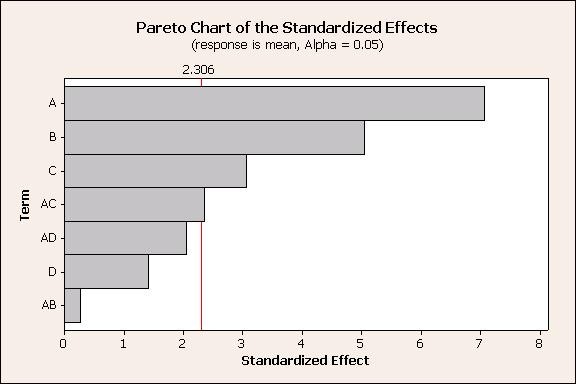
The Pareto chart above showed the team the interaction among factors that had a significant impact on overall performance..
The DOE helped the team come to the conclusion that getting calls to the right people with the right skills at the right time would produce the optimal customer experience. To further evaluate the relationships between the number of associates, amount of calls, and process lead time, the team used 3D scatterplots in Minitab.
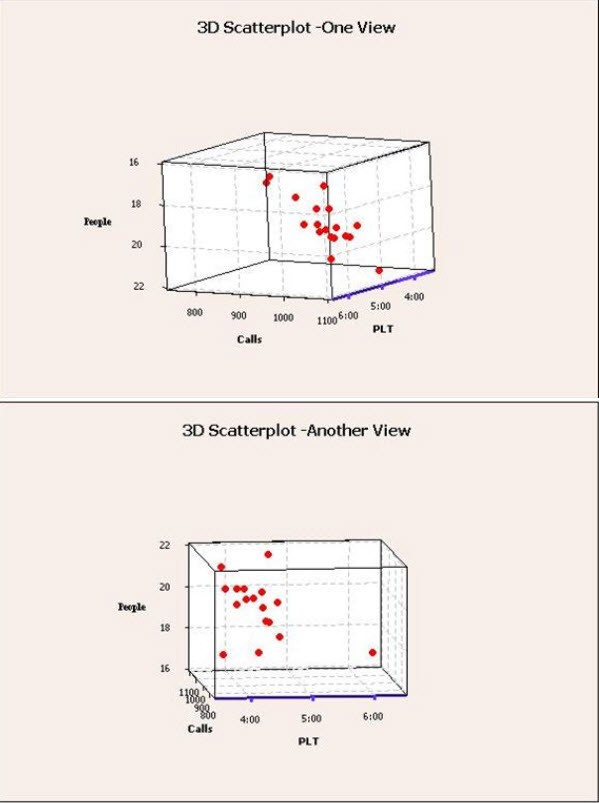
Using 3D scatterplots in Minitab, the project team at Edward Jones was able to evaluate relationships between three variables at once by plotting data on three axes.
“3D scatterplots show the power of Minitab,” Toro says. “We were able to easily drill down and determine the key factors and the key levels for each variable.”
Results
Now, by assigning associates who have certain skills to the most appropriate areas, the service division has increased the capacity of their existing team by over 10 percent, while also improving all of the call-center metrics they set out to fine-tune—including average handling time, average speed to answer, and the time it takes employees to complete after-call work.
The customer service associates are also much happier in their positions. Many have remarked that they have not only been able to answer more calls in their workdays, but that their workdays flow much more smoothly, and they’ve found extra time to focus on learning and being even more knowledgeable in their respective subject areas.
“Rather than basing our improvements merely on intuition, we’ve been much more successful by using an approach that’s more fact-based and reliant on statistical analysis and Lean Six Sigma,” Toro says.
“And while using DOE to improve services is uncommon, it really shouldn’t be,” he continues. “Once you understand the principles of DOE, rather than just focusing on how to use the tools properly, you realize that the tools typically used for process improvement in manufacturing can be customized for use in the service sector—and really, everywhere.”

Organization
Edward Jones
Overview
- Full-service financial brokerage firm
- Headquartered in St. Louis, Missouri
- Staffed by more than 11,000 financial advisors located in more than 10,000 offices around the U.S. and Canada
- Founded in 1922
Challenge
Continue to meet high customer service standards in the midst of increasing service demands.
Products Used
Minitab® Statistical Software
Results
- Found that cross-training customer service employees on all subject areas was not as effective as training employees to be subject-matter experts in specific areas
- Increased the capacity of the current team by more than 10 percent
- Improved call-center metrics, such as average handling time, average speed to answer, and the time it takes employees to complete after-call work