In our switched-on world, power outages can be extremely inconvenient for individuals. But for businesses, even very brief interruptions can cause catastrophic losses.
Socomec is a leading manufacturer of power switching and changeover equipment, specializing in electrical distribution and energy supply continuity. By ensuring energy availability, Socomec’s products protect critical facilities around the world from the disastrous consequences of a commercial power outage.
Seeking to expand the company’s client base, a Lean Six Sigma project team at Socomec’s French office set out to diagnose and address problems within the organization’s sales process. By analyzing data with Minitab Statistical Software, the project team identified the most effective components of Socomec’s sales operation. Their work led to the customization of Socomec’s customer relationship management (CRM) software, and highlighted the need for a global review of the company’s sales organizations.
The Challenge
Though the project team was based in France, their goal was to optimize the sales process and increase revenue at Socomec’s subsidiaries in Europe and across Asia. To acquire a full understanding of the current process, the project team interviewed sales team members and gathered information about the activities with the greatest impact on revenue.

A project team at Socomec used Minitab Statistical Software to analyze data that would customize its customer relationship management software and initiate a global effort to improve its sales operation.
After conducting interviews, they observed and recorded information about the activities of 70 sales team members in 9 offices. They collected a large amount of data, including the number of sales calls placed, appointments attended, sales quotes sent and subsequent follow-ups, sales orders processed, and successful business renewals.
Now the team needed to determine what the data could tell them about their sales process. They had gathered information about more than 400 factors, but in order to form the best business strategy they needed to extract insights they could act on.
How Minitab Helped
With the data in Minitab Statistical Software, the team used regression analysis to understand the relationship between sales operations and revenue. They identified important factors that influenced revenue and used contour plots—which express three-dimensional relationships in two dimensions—to show how two of these factors could work together to achieve their revenue objectives.
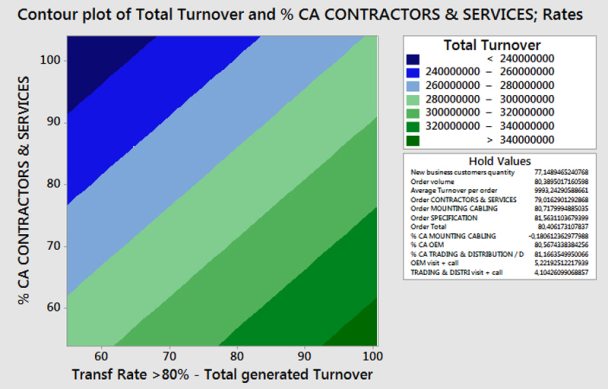
The contour plot above displays the effect of Transfer Rate and Contractors & Services (plotted on the x- and y-scales, respectively) on Total Turnover, or revenue (represented by the shaded region). The dark green zone indicates high revenue, and establishes optimal input values.
After their initial analysis revealed that optimal revenue could be achieved by combining a higher transfer rate with a lower turnover in contractors and services, the team began digging deeper into their sales operation data to determine where process changes could be made. Ultimately, they categorized each member of the sales team according to profiles (Sedentary, Traveling, Manager, and Engineer), measured the effect of each profile on revenue, and compared them to assess their relative importance. The project team used the Analysis of Variance (ANOVA) tools in Minitab’s Assistant menu to investigate the relationship between revenue and the roles of different sales team members.
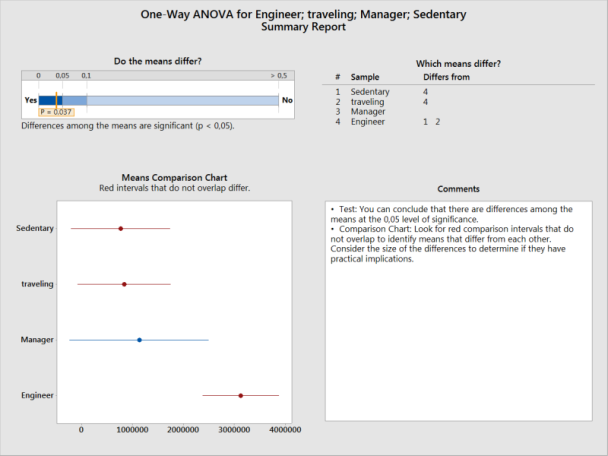
The team used the one-way ANOVA tool in Minitab’s Assistant menu to investigate the relationship between revenue and the sales team’s profiles: Sedentary, Traveling, Manager, and Engineer. The output from the Assistant is straightforward and easy to interpret, making it clear that the mean revenue associated with the Engineer profile differs from the mean revenue associated with Sedentary and Traveling profiles.
An examination of the varying effects of each profile category on revenue revealed that the mean revenue associated with Engineers was statistically different from the means produced by the Sedentary and Traveling categories.
Because different people find it easier to understand different types of visualizations, Minitab’s powerful graphics can quickly display data in a variety of ways. For example, the individual value plot shown below offers an alternative perspective on the same data about sales team profiles.
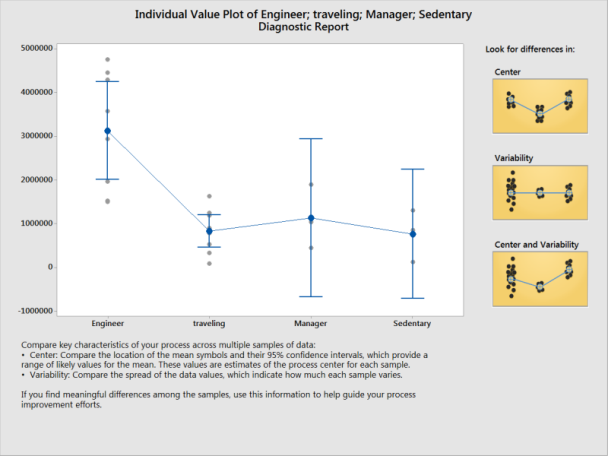
An individual value plot examines the individual values in each sample in order to assess sample distributions. By graphing each value separately, the graph displays the spread of the distribution and helps to identify potential outliers. The plot above confirms that the mean revenue pertaining to Engineers is larger than that of sales team members with Traveling, Manager, or Sedentary profiles.
Understanding the aspects of sales operations that had the most positive influence on revenue helped the project team focus their efforts on the processes with the greatest potential for achieving company goals.
Results
Data analysis enabled the Lean Six Sigma team to identify which sales activities had the greatest impact on revenue, and even suggested possible solutions for improvement. Based on their findings, the project team implemented changes to the sales process, including new sales indicators, adjusted job descriptions, and improved task delegation within the sales team. The changes were initially tested in France, and have since been extended to Socomec’s offices in the Netherlands and Germany.
The success of Socomec’s sales optimization project increased awareness of the need to review global sales operations and spurred the company on to customize Socomec’s customer relationship management (CRM) software. CRM customization will enable sales team members to gauge their own performance based on the latest sales results and updated metrics, and to choose actions that will help achieve sales goals.

Organization
Socomec
Overview
- Leading manufacturer of power switching and changeover products
- Transfers supply to operational backup source
- Established in 1922
- Employs approximately 3,100
- 30 subsidiaries on all 5 continents
- Yearly revenue over $3.7 billion
Challenge
Optimize regional sales operations to increase revenue.
Products Used
Minitab® Statistical Software
Results
- Confirmed sales activities that positively affect revenue
- Identified solutions for improvement
- Implemented improvements across multiple sales teams
- Kicked off global effort to improve sales teams throughout the company