- New Features & Enhancements
- Full Update Notes
- Get the Update
Minitab 22 Features & Enhancements
Minitab Statistical Software Version 22.1.0 is available to customers who manage their Minitab subscription in the Minitab License Portal. This release includes new features and enhancements.
New Statistical Methods
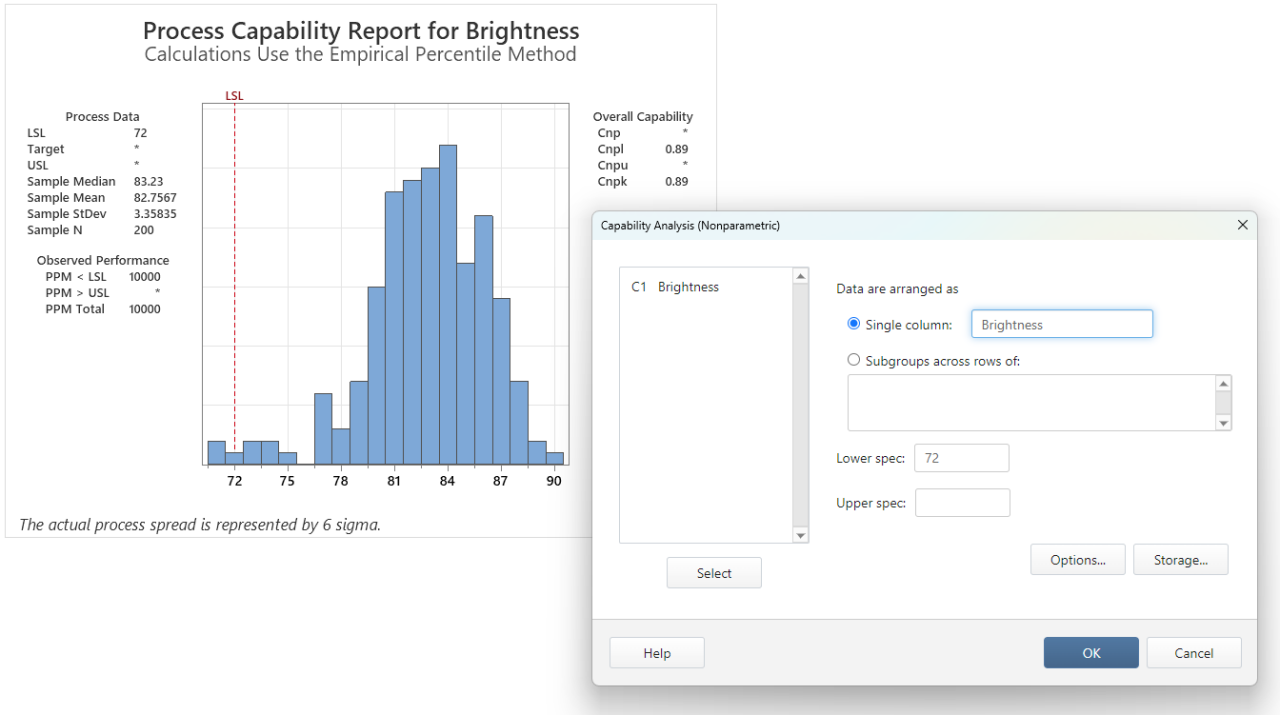
Nonparametric Capability Analysis
Nonparametric Capability is in the Stat > Quality Tools > Capability Analysis menu.
User Benefit
Nonparametric Capability provides a robust solution to evaluate the capability of a process without any assumptions about the distribution of the data.
Summary
Capability analysis determines if a process can produce output that meets customer requirements. This determination depends on making the correct distribution assumptions or applying an appropriate transformation, like a Box-Cox or Johnson transformation. Nonparametric capability analysis provides a robust solution without any assumptions about the distribution of the data.
Automated Capability Analysis
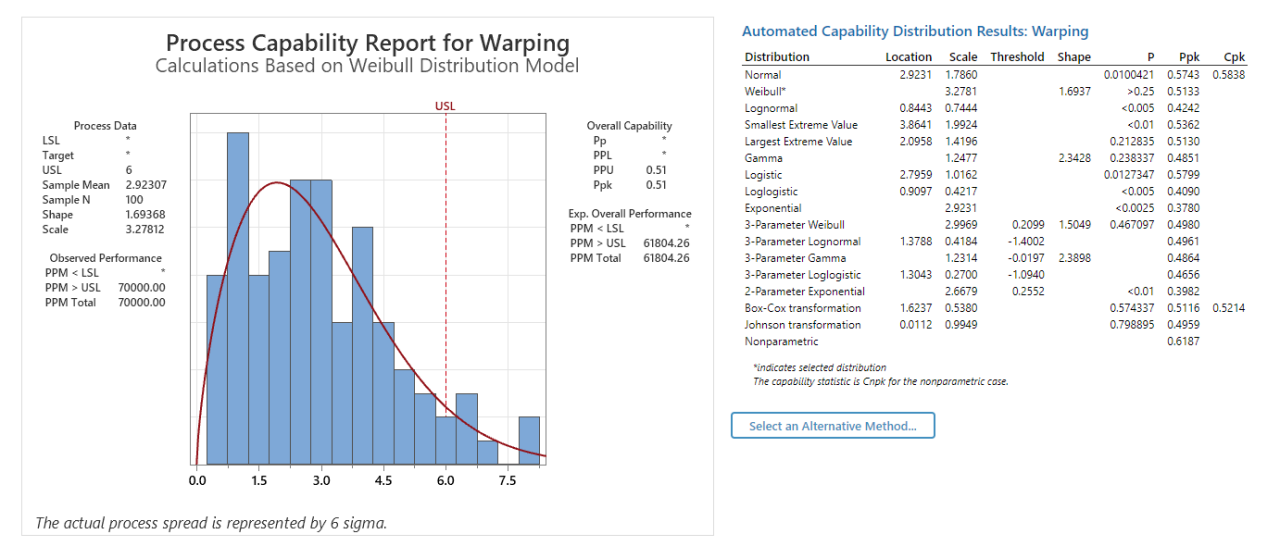
Automated Capability is included in the Stat > Quality Tools > Capability Analysis menu.
User Benefit
When process data follow a nonnormal distribution, the search for an appropriate distribution or transformation becomes tedious and time-consuming. Automated Capability automatically selects an appropriate distribution, transformation, or nonparametric method to determine how well the process output meets customer specifications.
Summary
Automated Capability determines the appropriateness of the normal distribution and automatically presents alternative distribution fits or transformations. You can also use process knowledge to choose a different method from the automatic selection.
Evaluate Measurement Process (EMP Crossed)
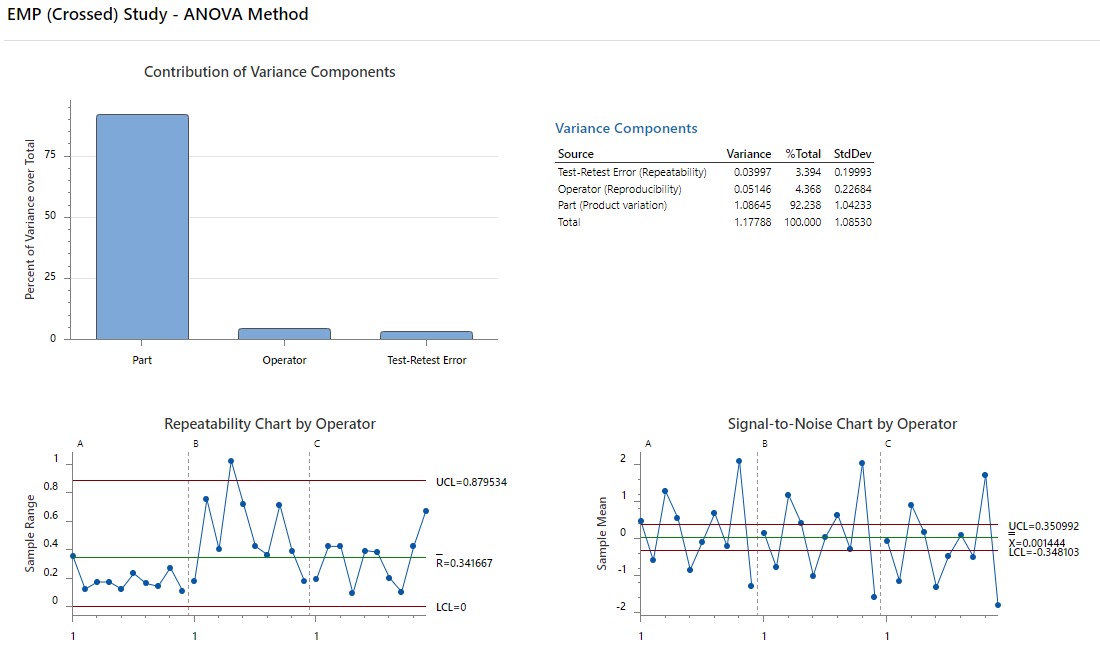
Evaluate Measurement Process (EMP Crossed) is included in the Stat > Quality Tools > Gage Study menu.
User Benefit
When you assess the adequacy of a measurement system, one criterion is the ability of the measurement system to detect process changes. Dr. Wheeler’s Evaluating the Measurement Process (EMP) method considers this criterion and is a new alternative to the current Gage Study tools.
Summary
Evaluate Measurement Process (EMP Crossed) provides the tools to assess the process variation in a measurement system with crossed designs using the preferred Wheeler’s EMP criterion.
Improvement: One-Proportion Hypothesis Test and Confidence Intervals
User Benefit
Several improvements have been made to the One-Proportion Hypothesis Test and Confidence Intervals. Minitab now includes additional methods to improve the accuracy and appropriateness of results, including Wilson-score and Agresti-Coull. Also, you can now define the event value in the dialog.
Summary
Minitab Statistical Software includes updated and improved estimation methods for One-Proportion Hypothesis Tests and Confidence Intervals.The One-Proportion hypothesis test and confidence interval estimation methods have been updated and improved.
Visualizations
New: Interactive Pareto Chart
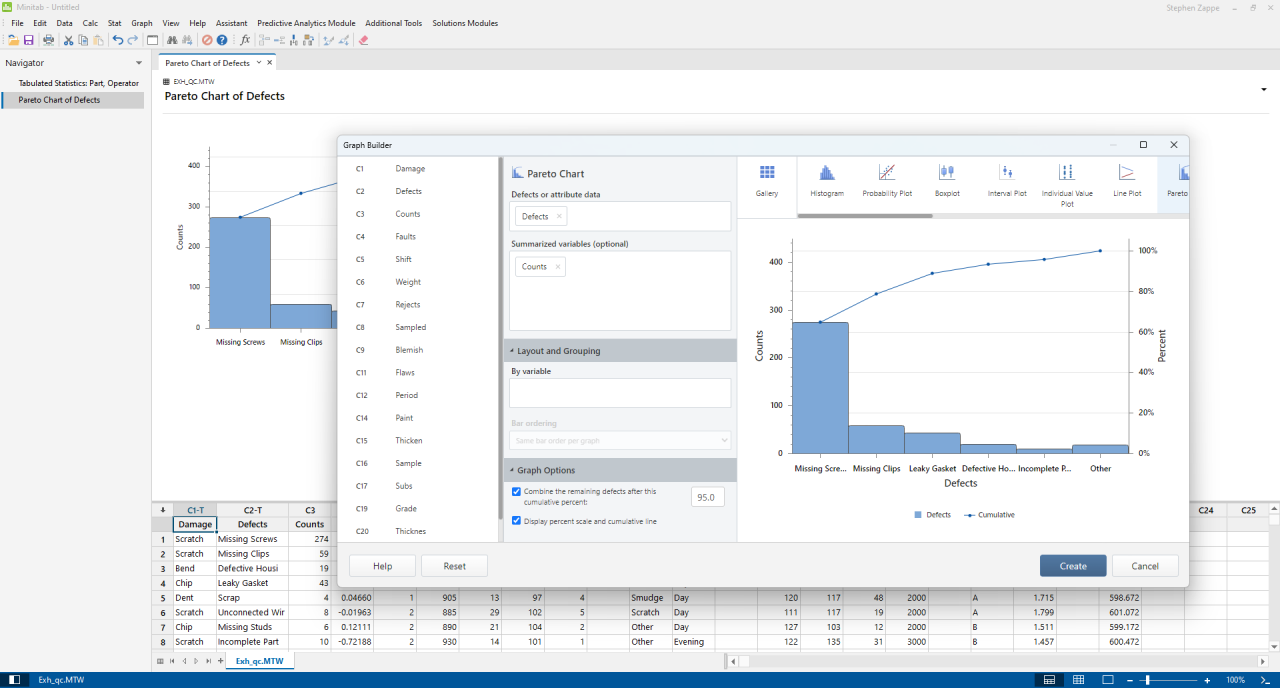
Interactive Pareto Chart is now available in Graph > Graph Builder.
User Benefit
Use the Graph Builder’s drag-and-drop interface to build Pareto charts. The live preview helps to identify features like the defects to prioritize or the characteristics that contribute most to an outcome.
Summary
Graph Builder now includes an interactive Pareto Chart tool.
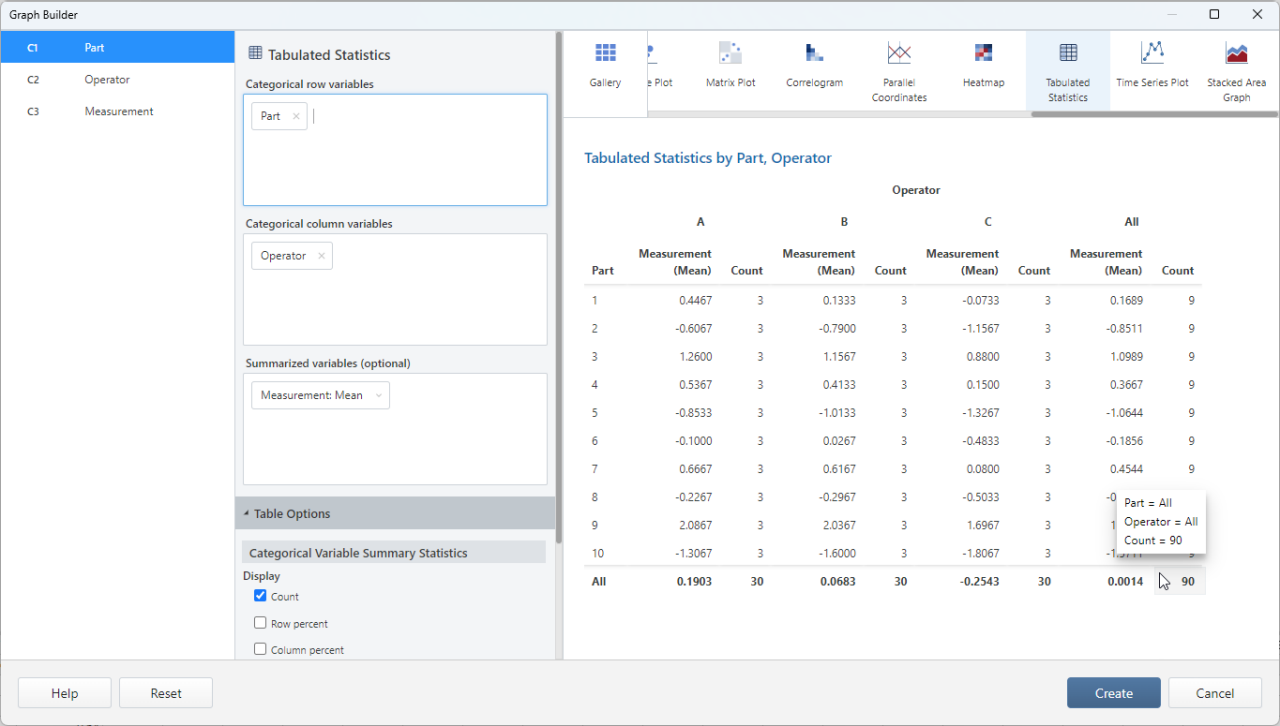
New: Interactive Tabulated Statistics
Interactive Tabulated Statistics tool is now in Graph > Graph Builder.
User Benefit
Interactively explore relationships between variables and build meaningful descriptive statistics tables using the Graph Builder’s drag-and-drop interface and live preview. The redesigned table improves the readability and the overall user experience.
Summary
Graph Builder now includes an interactive Tabulated Statistics tool.
Improvement: Additional Graph Editing Capabilities for Interactive Graphs
Show/hide gridlines at major tick positions
Add reference lines on continuous scales
Add Y-value data labels
Customize graph size with an option to maintain aspect ratio
User Benefit
Interactively customize your results with new graph editing features.
Summary
Show/hide gridlines at major tick positions
Display or hide gridlines at major tick positions on an existing graph.Add reference lines
Add reference lines at values along a continuous scale on an existing graph.Add Y-value data labels
Display Y-value labels for primary data representations on an existing graph. For example, this feature adds data labels to outliers on a boxplot or bars on a bar chart.Customize the graph height and width
Change the height and/or width of an existing graph. An option is available to maintain the aspect ratio of a graph when you specify one dimension.
Minitab 21 Features & Enhancements
Minitab 21.4.2 provides important bug fixes.
Minitab 21.4.1 provides important bug fixes and two optional add-on modules for professionals who want guided analyses for research and development departments or reliability analysis.
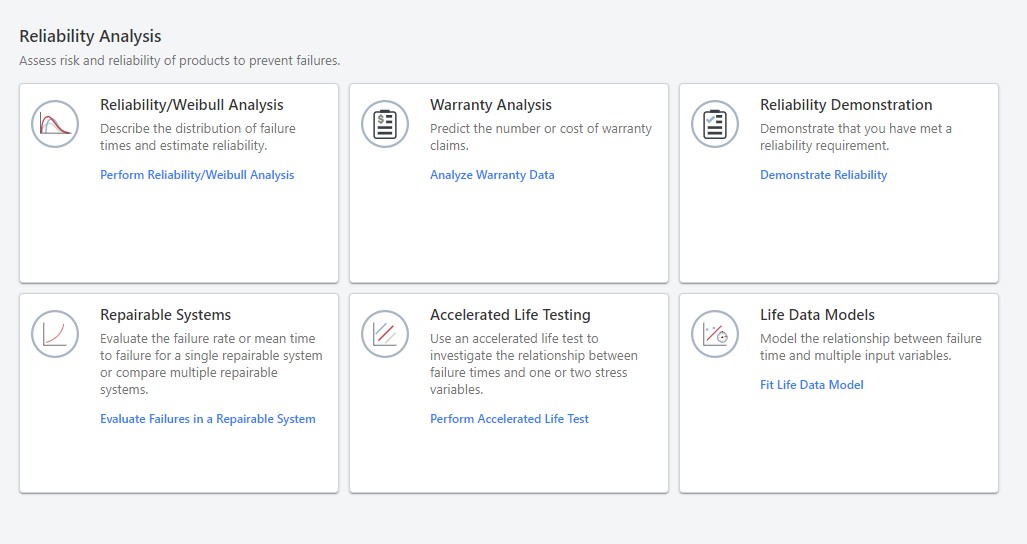
Feature Addition: Reliability Module
User Benefit
Minitab’s Reliability Module places the most robust calculations conveniently within reach, enabling accurate insights and informed choices.
Summary
The Reliability Module equips engineers with the tools they need to perform warranty analysis, use life data models, and conduct reliability/Weibull analysis. With these features, you can identify and eliminate issues with your products, ensuring they function smoothly and reliably for your customers.
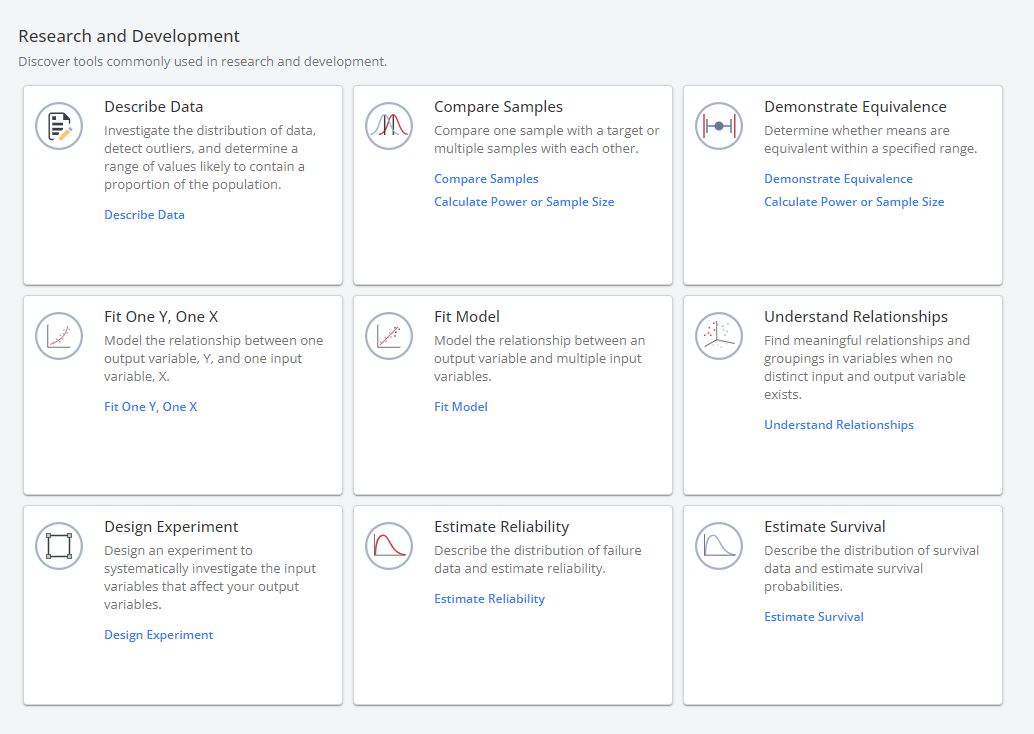
Feature Addition: Research and Development Module
User Benefit
With its intuitive interface and comprehensive set of tools, Minitab's Research and Development Module empowers professionals in the R&D field to delve into complex data analysis with the best tools right at their fingertips.
Summary
The Research and Development Module empowers researchers and engineers to rapidly begin designing experiments, estimating reliability and survival, describing data and understanding relationships among variables.
This update includes our proprietary MARS® Regression feature which expands upon Minitab’s predictive analytics capabilities to create accurate predictive models for a continuous response with many continuous and categorical predictor variables. Minitab 21.4 also includes graph editing enhancements and the ability to update or create new results for some statistical features when data change.
New Feature: Multivariate Adaptive Regression Splines (MARS)
User Benefit
MARS® is an important alternative analytical technique when conventional regression methods fail to work.
Summary
MARS® is our latest advanced predictive analytics solution that uncovers important data patterns and relationships that are difficult, if not impossible, for other regression methods to reveal. The MARS modeling engine builds its model by piecing together a series of straight lines, with each allowed its own slope. This permits the MARS modeling engine to trace out any pattern detected in the data.

New Feature: Interactive Graph Editing
- Add Regression Fit for Scatterplot & Matrix Plot
- Add Percentile Line for Probability Plot
- Adjust Probability Plot Y-Scale
- Adjust Histogram Binning
User Benefit
This graph editing feature update allows users to customize their results.
Summary
Add Regression Fit for Scatterplot & Matrix Plot
This feature provides the option to add a regression fit to an already-created scatterplot or matrix plot via the editing pane and specify the type as well as whether to include the y-intercept.
Add Percentile Line for Probability Plot
This feature provides the option to add percentile lines at specified values along the X or Y scale to an already-created probability plot. Note: this option will apply to the selected graph only.
Adjust Probability Plot Y-Scale
This feature will provide the option to change the Y-scale type between percent, probability, and score on an already-created probability plot. Note: this option will apply to the selected graph only.
Adjust Histogram Binning
This feature provides the option to change the interval type on the X-scale (binning) between midpoint and cutpoint as well as the interval definition for binning by specifying the number of intervals or choosing custom midpoint/cutpoint positions on a histogram. Note: this option will apply to the selected graph only.
Minitab’s Graph Builder now includes Interval Plot and Matrix Plot. For subscriptions that use the Minitab License Portal, the login experience has changed. Also, three optional add-on modules are now available for professionals who want guided analyses for the insurance industry, measurement system analysis, and sample size analysis.
Visualizations
Features Update: New Graphs Added
Interval Plot
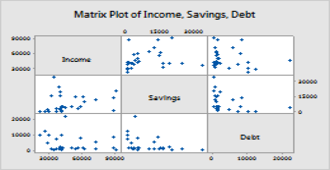
Matrix Plot
User Benefit
These new graphs are useful when working with a large sample size and assessing relationships between several pairs of variables at once.
Summary
A matrix plot is a matrix of scatterplots that display two-way relationships between a set of variables. The Interval plot displays a t confidence interval for the mean. Confidence intervals can be displayed for multiple variables and subsets of the data. Since it is important to provide some options associated with the confidence interval methods, Minitab presents proper confidence intervals under various scenarios for user convenience.
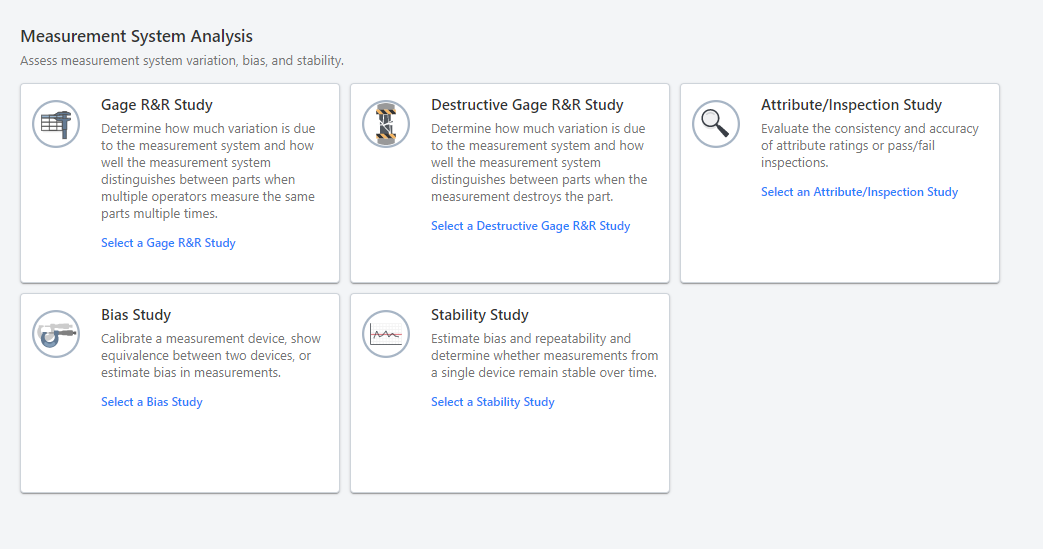
Feature Addition: Measurement System Analysis Module
User Benefit
Minitab’s Helps users streamline problem-solving without worrying about selecting which analysis to use.
Summary
Minitab's Measurement System Analysis Module provides guided data analysis to solve the most common MSA challenges. Explanations are provided for each analysis, while our industry-leading technical support team is available via phone or email to help.
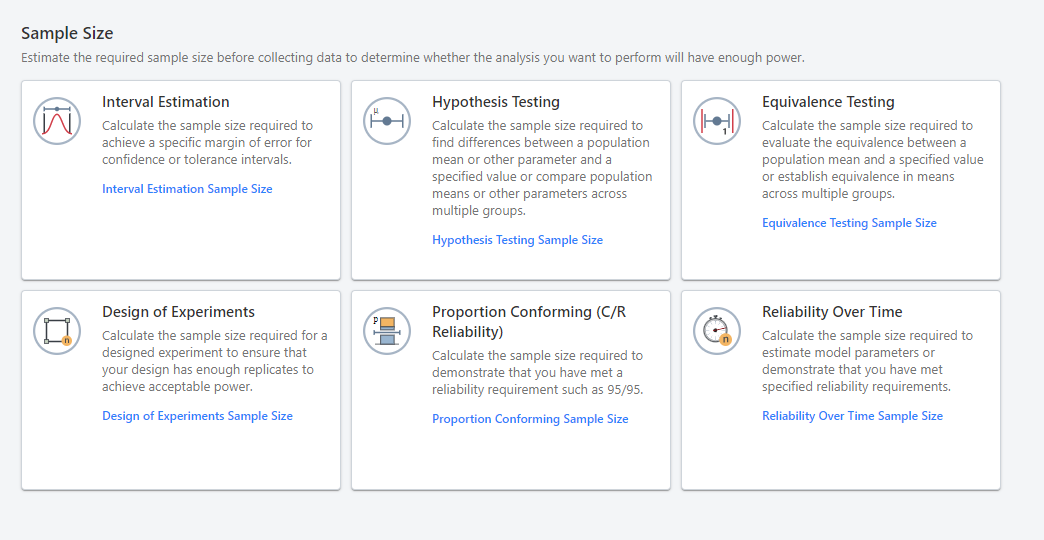
Feature Addition: Sample Size Module
User Benefit
Minitab’s Samples Size Module helps users estimate required sample size quickly and seamlessly.
Summary
Minitab's Sample Size Module provides guided data analysis to estimate the required sample size to determine whether the analysis you want to perform will have enough power to meet your needs.
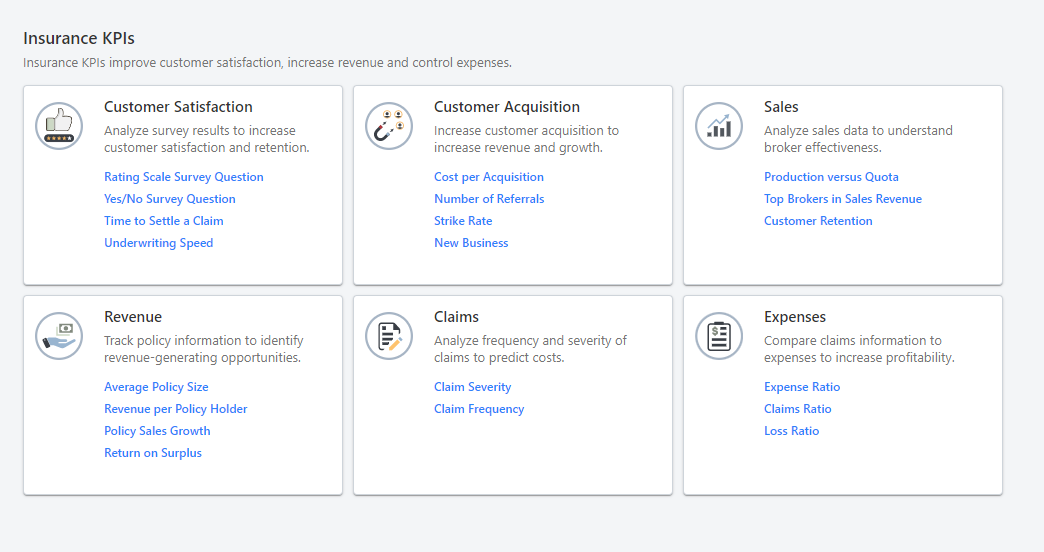
Feature Addition: Insurance Module
User Benefit
Minitab’s Insurance Module helps to provide data-driven insights into opportunities to improve customer satisfaction, increase revenue, and control expenses.
Summary
Written with insurance industry professionals in mind, Minitab's Insurance Industry Module provides guided data analysis to solve common insurance industry challenges. Shift your focus to improving key performance indicators (KPIs) like Time to Settle a Claim, Revenue per Policy Holder and Claims Ratios without worrying about which analysis to use.
Minitab Statistical Software has added Forecast with Best ARIMA Model, Augmented Dickey-Fuller Test, and Box-Cox Transformation to our Time Series features. Graph Builder now includes Line Plot, Stacked Area Graph, and Pie Chart and enhancements to Histogram and Time Series Plot. For compliance reasons, this software release also ensures that users on high school subscriptions cannot navigate to our website from within our apps (Minitab Statistical Software web, Minitab Statistical Software desktop, and License Portal).
Statistical Method
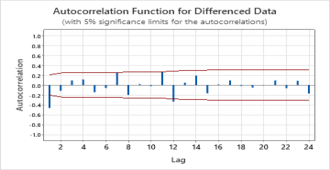
New Time Series Update: Augmented Dickey-Fuller Test
User Benefit
This command provides an objective way for users to decide whether to difference a time series to make it stationary before fitting an ARMA model.
Summary
Augmented Dickey-Fuller Test determines whether differencing makes the mean of the data stationary. This command is used to determine the nonseasonal differencing order when you analyze your time series data with an ARIMA model.
Statistical Method
New Time Series Update: Box-Cox Transformation
User Benefit
Box-Cox Transformation stabilizes the variance of a time series over time for better forecasting results.
Summary
Box-Cox Transformation is a technique available on the MSS Time Series menu. It is used to make the variance of transformed time series data unchanged over time.
Statistical Method
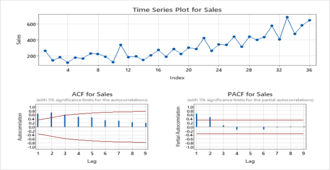
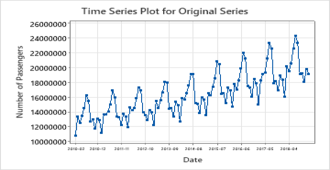
New Time Series Update: Forecasting Best ARIMA
User Benefit
The Forecasting Best ARIMA command will do the model selection analyses for the user automatically, saving them time from having to evaluate different ARIMA models themselves and selecting best model.
Summary
Forecasting Best ARIMA automatically forecasts the future values of a times series data set. The user can also select a simpler-but-equally-good alternative model to avoid any over-fitting problems. The user is empowered to decide whether the selected model can fit the data reasonably well and produce reliable forecasting results.
Visualizations
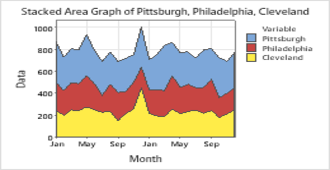
Graph Builder Update: New Graphs Added
- Line Plot
- Stacked Area Graph
- Pie Chart
User Benefit
These new graphs empower users to choose the best graph when utilizing Graph Builder for their analysis.
Summary
Graph Builder’s easy-to-browse gallery lets users seamlessly switch from one graph to the next using the same selection of data and without re-running your analysis. Users will now be able to select newly added graphs from Graph Builder: Line Plot, Stacked Area Graph, and a Pie Chart.
Minitab Statistical Software now offers two optional add-on modules for professionals who want guided analyses for supply chain operations or customer contact centers.
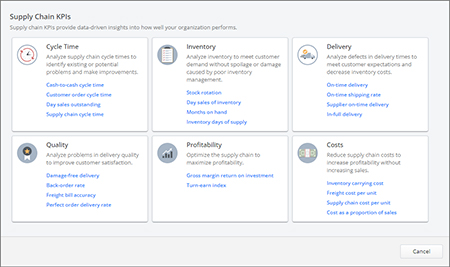
Feature Addition: Supply Chain Module
User Benefit
Direct prompts, statistical guidance, and support pages are specifically written for supply chain professionals in familiar terminology so they can focus on improving key performance indicators (KPIs) like cycle time, inventory, delivery, quality, profitability, and costs without worrying about which analysis to use.
Summary
Our Supply Chain Module empowers supply chain experts and professionals to leverage data analysis to tackle any challenges faced in their supply chain.
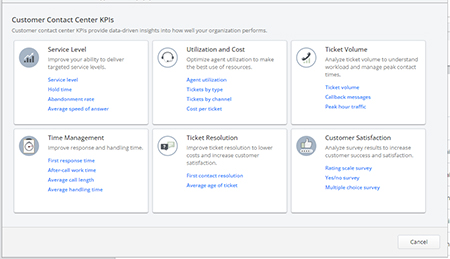
Feature Addition: Customer Contact Center Module
User Benefit
Direct prompts, statistical guidance, and support pages are specifically written for customer contact center professionals in familiar terminology so they can focus on improving key performance indicators (KPIs) like service level, utilization and cost, ticket volume, time management, ticket resolution, and customer satisfaction without worrying about which analysis to use.
Summary
The Customer Contact Center Module empowers customer contact experts and professionals to leverage data analysis to tackle any challenges faced in customer care.
Our latest release, Minitab Statistical Software Version 21.1.0 is available to customers who manage their Minitab subscription in the Minitab License Portal. This release includes new features and bug fixes.
Statistical Method
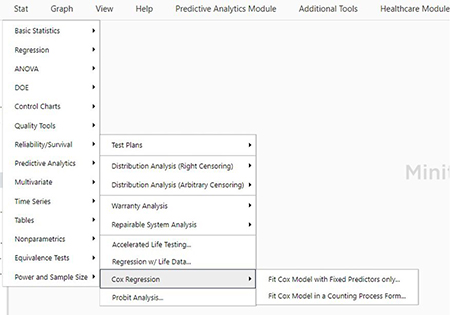
Cox Regression
Addition: The Cox Regression command is included under the Reliability menu. Models can be fit:
- with fixed predictors only
- in a counting process form
User Benefit
Cox Regression is a method for investigating the effect of several variables upon the time it takes for a specified event to happen.
Summary
Cox Regression, also known as Proportional Hazards Regression, is one of the most popular regression techniques for survival outcomes.
Visualizations
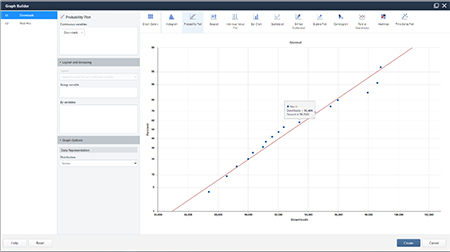
New: Interactive Probability Plot in Graph Builder
Addition: An interactive probability plot is now available in Graph Builder.
• Select fits from 14 distributions
User Benefit
The graph builder gallery will fit probability plots for continuous variables.
Summary
Graph Builder now includes an interactive probability plot.
Additions
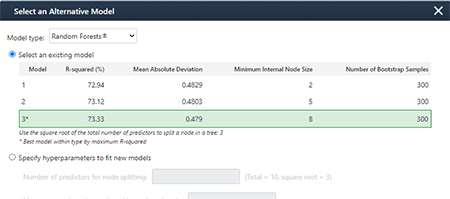
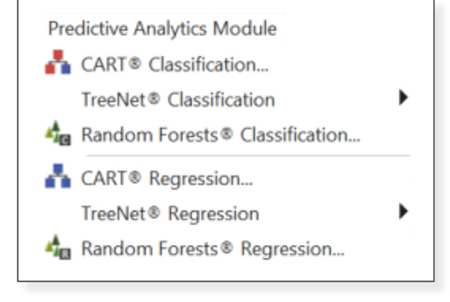
Automated Machine Learning in Predictive Analytics Module
User Benefit
It is common for researchers to try a few different machine learning models when evaluating their data. This new AutoML feature will evaluate the following models:
- Classification and Regression Trees (CART®)
- TreeNet®
- Random Forests®
- Regression
Summary
Validation prevents model overfitting, which is an important aspect in machine learning. This feature is now available in the Predictive Analytics menu and within Stat-Regression, Stat-Binary Logistic Regression and Stat-Poisson Regression.
Minitab 20 Features & Enhancements
Minitab Statistical Software has been updated to include an additional visualization, Bubble Plot, in Graph Builder. This update is also compatible with Minitab’s Healthcare Module, our optional add-on purpose built with healthcare professionals in mind.
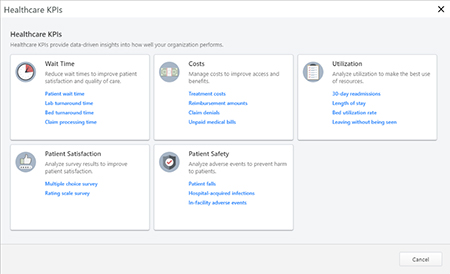
Feature Addition: Healthcare Module
User Benefit
Direct prompts, statistical guidance, and support pages are specifically written for healthcare professionals in familiar terminology so they can focus on improving key performance indicators (KPIs) like wait time, costs, utilization, patient safety, and patient satisfaction without worrying about which analysis to use.
Summary
Minitab's Healthcare Module empowers healthcare experts and professionals to leverage data analysis to tackle any challenges faced in healthcare
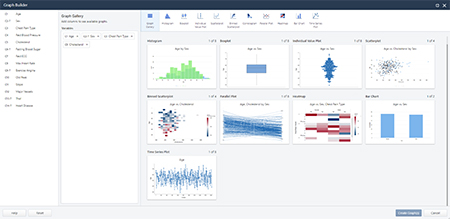
Minitab Statistical Software has been updated to include Graph Builder, a new way to revisualize your data and explore graph alternatives with an interactive and easy-to-browse gallery.
Addition
Graph Builder
User Benefit
Quickly create and choose the visualization that best displays your insights with our interactive, easy-to-browse gallery that let’s you seamlessly switch from one graph to the next using the same selection of data and without re-running your analysis.
Summary
Graph Builder gives you the power to create and change visualizations quickly, so you can focus on choosing the right visual to accurately communicate your insights and achievements.
This update includes additional visualizations, integrations and general improvements.
Updated Visualization
Variables for Binned Scatterplot, Parallel Coordinates Plot, and Heat Map
User Benefit
Graphs can be split by variables faster, removing the need to first subset the data before creating these graphs.
Summary
In each of these dialogs, grouping variables can be designated using the By Variable section.

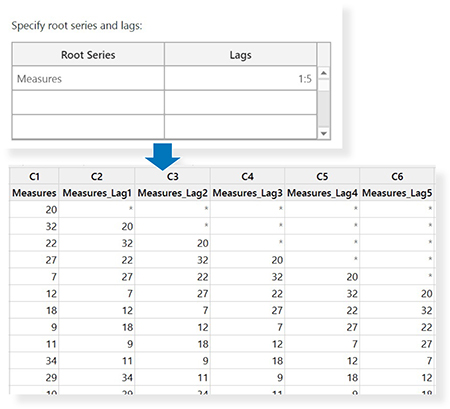
Improvement: Lag
User Benefit
Lagged columns are commonly used in time series modeling and supervised machine learning, such as CART, TreeNet, and Random Forests. This improvement allows for faster data preparation.
Summary
Numerous lag columns can be easily generated for one or multiple time series columns. This command is located in Stat-Time Series-Lag.
Addition
R Integration
Call R scripts from Minitab Statistical Software. R is a language and environment for statistical computing and graphics.
R scripts can run in 3 ways:
- Run the RSCR in the command line pane
- Run a Minitab exec that includes the RSCR command
- Customize the interface to run a Minitab exec that includes the RSCR command
Summary
Execute external R scripts that use Minitab Statistical Software variables (columns, constants, matrices) as inputs. Results are returned to Minitab and displayed in the output navigator and output pane.

Addition
Minitab’s Predictive Analytics Module
User Benefit
Tree-based methods empower predictive analytics with not only speed to answer, but also remarkable accuracy and ease of interpretation. Users can quickly understand the key drivers of a process.
Summary
Our proprietary, best-in-class, tree-based machine learning algorithms not only have the power to provide deeper insights and visualize multiple complex interactions with decision trees but are equipped to handle larger data sets with more variables, messy data, missing values, random outliers, and non-linear relationships. These methods are now available in a module that you easily add to Minitab Statistical Software.
Addition
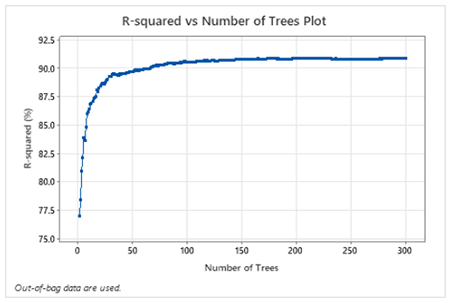
Random Forests®
New Feature: Random Forests consists of many individual decision trees that operate as an ensemble.
User Benefit
Random Forests generally provides better predictive power than a single decision tree.
Summary
Based on a collection of CART Trees, Random Forests leverages repetition, randomization, sampling, and ensemble learning in one convenient place that brings together independent trees and determines the overall prediction of the forest.
Addition
TreeNet® (Gradient Boosting)
New Feature: TreeNet Classification and TreeNet Regression. Includes Fit Model and Discover Key Predictor submenus.
User Benefit
Gradient boosting can deliver optimal prediction accuracy and unique insights.
Summary
Our most flexible, award-winning and powerful machine learning tool, TreeNet Gradient Boosting, is known for its superb and consistent predictive accuracy due to its iterative structure that corrects combined errors of the ensemble as it builds.
New Visualizations
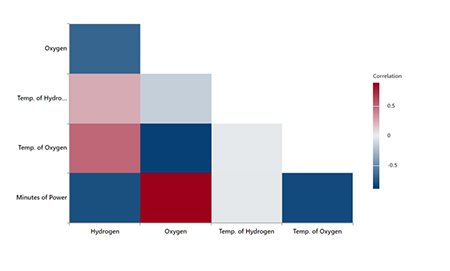
Correlogram
User Benefit
Correlograms are useful for finding important correlations when faced with many variables. Viewing correlations as a color gradient is an alternative approach to displaying a matrix plot or a table of correlation statistics.
Summary
The correlogram makes it easy to visualize a matrix or correlations, particularly when the number of variables is large.
Minitab Available on the Cloud
Minitab is now accessible Now from anywhere on the Cloud
- Access from nearly any device
- Available as both our desktop and new web app
- Share projects with a single click
- Access and store from Google DriveTM, Microsoft OneDrive® or local files
- Single sign-on available
Improvements
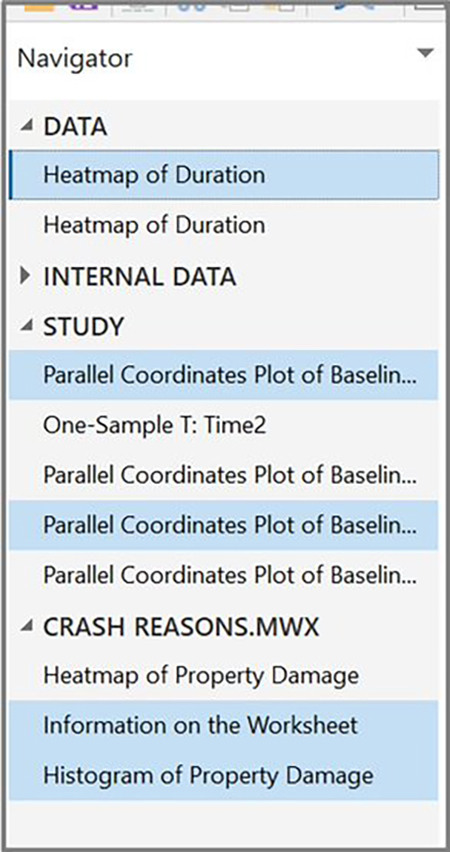
Interface Improvement: Multi-Select in the Navigator
User Benefit
Selecting a range of output makes it easier for users who need to remove or send output from the Navigator.
Summary
One of the top feedback items from users, this improvement makes sending or removing multiple items from the navigator much easier.
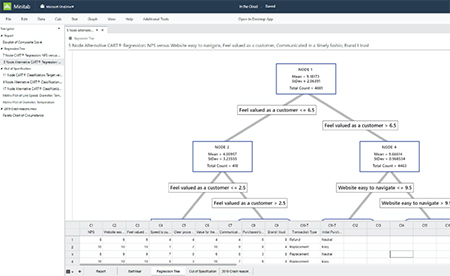
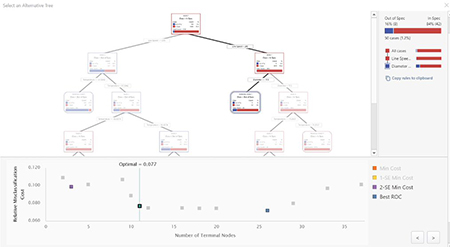
Improved Model Selection for Classification and Regression Trees
User Benefit
Users can see the decision tree, model and node details in a single view, making alternative model selection easier than ever.
Summary
When users choose to view an alternative tree, a single view provides them with detailed information for all possible models.
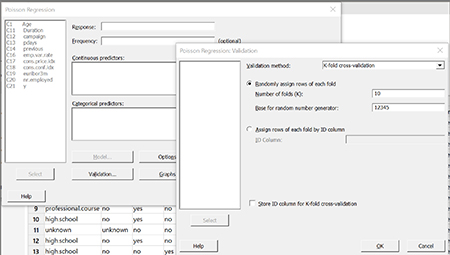
Model Validation in Binary Logistic Regression and Poisson Regression
Variability Chart
User Benefit
Validation is the process of evaluating a trained model on a test data set. This feature makes it easier for users to create useful models.
Summary
Validation prevents model overfitting, which is an important aspect in machine learning. This feature is now available in the Predictive Analytics menu and within Stat-Regression, Stat-Binary Logistic Regression and Stat-Poisson Regression.
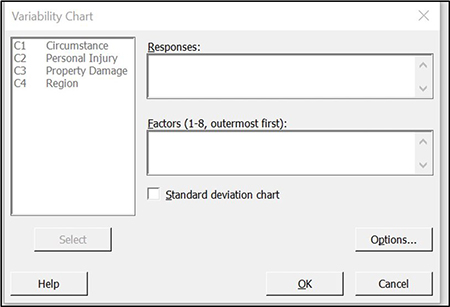
Visualizations
Variability Chart
1. The ability to specify multiple response variables for a given set of factors – this results in multiple graphs, one for each response.
2. The ability to brush individual observations.
User Benefit
It is easy to create multiple variability charts with a single click. Also, exploring data is easier with the added ability to brush individual observations.
Summary
The Variability chart dialog can now support multiple responses, and brushing points is available when interacting with the graph.
New Visualizations
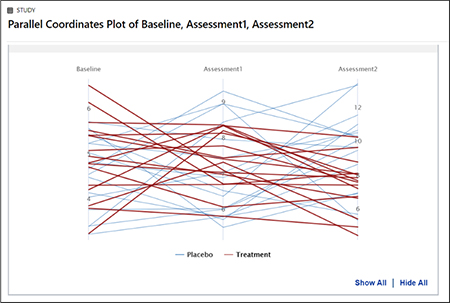
Parallel Coordinates Plot
User Benefit
Parallel plots represent high dimensional data as a two-dimensional visualization. Data is represented in the form of a line making it easy to visualize trends.
Summary
The parallel coordinates plot is an efficient way to visualize multidimensional and multivariate data.
New Visualizations
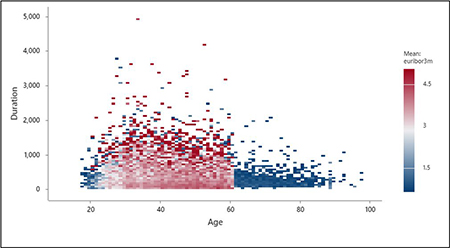
Binned Scatterplot
User Benefit
Using a gradient to differentiate the density of data on a scatterplot makes it easier to communicate information to users. Users can also define the gradient as an average of another variable, providing additional flexibility for the visualization.
Summary
Binned scatterplots create meaningful graphics when displaying information for large data sets.
New Visualizations
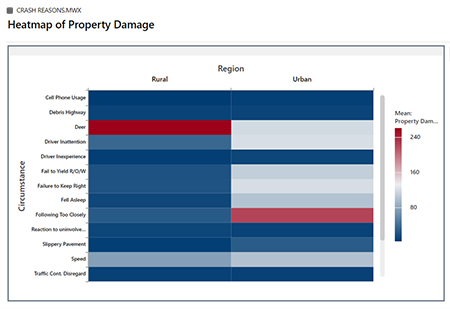
Heat Map
User Benefit
Heat maps identify areas of interest. They can quickly uncover scenarios that lead to a high or low values.
Summary
Heatmaps are located in the Graph menu, between the bar and pie Charts. When you have a large number of factor levels, they may be easier than a bar chart to communicate areas that are different.
Minitab 22 Full Update Notes
Release Date: 20 March 2024
Minitab Statistical Software Version 22.1.0 is available to customers who manage their Minitab subscription in the Minitab License Portal. This release includes new features and enhancements.
New Features in Minitab 22.1.0
New Statistical Methods
- Nonparametric Capability
- Automated Capability
- Evaluate Measurement Process (EMP Crossed)
Improvements
- One-Proportion Hypothesis Tests and Confidence Intervals
Visualizations
- Interactive Pareto Chart
- Interactive Tabulated Statistics
- Additional Graph Editing Capabilities for Interactive Graphs
Problems Resolved in Minitab 22.1.0
Desktop and Web Application
- In some cases, the rounding rules in the Descriptive Statistics table made the calculation look incorrect. (165423)
- The LET command handled missing values inconsistently when run as part of a macro and when run outside of a macro. (181599)
- Bubble plot gridlines were cleared after editing a graph and updating. (183095)
- When graph creation included data labels, editing Y-value data labels did not respond to changes. (183559)
- Duplicated control IDs in the Send to Report dialog caused assistive technologies to read the wrong label. (184753)
- Hidden series become visible without edits when edits are applied to other variables. (184888)
- Variable names that mimicked HTML tags did not show in graphs. (182860)
- Reliability commands failed to converge in data with mostly missing values. (185110)
- Live-linking did not update graphs when the SEPARATE variable changed. (185130)
- Data symbols in scatterplots that did not show if they were completely covered by other points remained hidden when they were uncovered by a scale change. (184751)
- The Analyze Mixture Design generated incorrect command language when the data was affected by numeric noise. (185842)
- Nonnormal capability analyses errored when the specification limits were much wider than the data. (185675)
- Cox Regression dialogs did not re-analyze categorical variable levels when the dialogs were re-opened. (186220)
- Older projects containing certain graph commands crashed when opened if the worksheet containing the graph source data had been deleted. (186238)
- Some calculations for confidence intervals used an incorrect denominator degrees-of-freedom. (186141)
- CART did not use the column Value Order to create cross-validation folds. (186201)
- Cross Tabulation duplicated long category names when the table exceeded the maximum output width. (133849)
- Output tables did not show some text edits after the initial changes. (185673)
- MANOVA would silently fail if an inestimable term was in the model in the multivariate case. (179979)
- A column name that contained an asterisk was confused with an interaction term in multiple regression. (186386)
- Some Reliability commands did not check for groups with all missing values before calculation. (186411)
- Accelerated Life Test Plans calculated sample sizes with the scaled variance instead of the unscaled variance in some cases. (186693)
Web Application
- Reference lines that were deleted in Minitab Desktop showed in a project opened in Minitab Online. (183069)
- Some labels in dialogs had incorrect visual styling. (183117)
- Undoing scale transformation changes in the presence of user-created reference lines could misplace the reference lines. (183596)
- If the original dialog did not issue the GRID subcommand, then gridline customization commands were not included when copying command language. (185158)
- Minitab Online used incorrect validation for user inputs containing a decimal separator that was not a period. (186522)
- Under highly abnormal data conditions, the AD statistic in probability plots ignored the contribution of extreme points. (186629)
- Non-ascii characters in project titles were displayed incorrectly in Minitab Online. (186625)
Desktop Application
- The unsupported YEAR formula caused a crash when subsetting on formula results. (185529)
- Individual Value Plot and Interval Plot tried to show unrendered groups after edits of individual symbols. (185595)
- Minitab dialogs were overwritten and not restored after showing the OSI PI connection dialogs. (185905)
- DDE link information did not capture the project title when saved so the link was disconnected when the project was opened. (186208)
- Column descriptions with too many characters caused too many lines to be added to the column description tooltip. (186591)
- When creating a LAYOUT, some graph types were saved to the LAYOUT before the creation of the layout, which caused a crash. (186740)
- Analyze Variability did not use the user-selected default histogram type. (186788)
- Saving a worksheet with an invalid cell selection location caused assertion errors when the project was reopened. (186847)
Minitab 21 Full Update Notes
Release Date: 20 March 2024
Minitab 21.4.3 provides a bug fix for the desktop sign-in process on some browsers.
Release Date: 8 November 2023
Minitab 21.4.2 provides important bug fixes.
Release Date: 12 July 2023
Minitab 21.4.1 provides important bug fixes and two optional add-on modules for professionals who want guided analyses for research and development departments or reliability analysis.
New Features in Minitab 21.4.1
- Research and Development Module - This optional add-on module empowers researchers to rapidly visualize data and relationships among variables, conduct statistical analysis to compare samples, calculate required sample sizes, fit regression models to predict outcomes, quickly design experiments to investigate relationships between inputs and outputs, and perform reliability and survival analysis.
- Reliability Module - This optional add-on module equips engineers with the ability to plan reliability testing and demonstrations, calculate required sample sizes, analyze censored data, fit regression models for failure times, perform accelerated life testing, conduct warranty analysis, and analyze repairable systems.
Problems Resolved in Minitab 21.4.1
Web Application
- When running some specific analyses and sending the output to a report, Minitab may crash. (189236)
Desktop and Web Application
- You cannot open MPX project files from a network location when deduplication is enabled. (185715)
- Various analyses with graphs crash Minitab 21.4 when 'My Footnote > Worksheet name' is enabled. (186218)
- Between/within capability analysis uses the wrong degrees of freedom for confidence intervals. (186305)
Release Date: 29 March 2023
This update includes our proprietary MARS® Regression feature which expands upon Minitab’s predictive analytics capabilities to create accurate predictive models for a continuous response with many continuous and categorical predictor variables. Minitab 21.4 also includes graph editing enhancements and the ability to update or create new results for some statistical features when data change.
New Features in Minitab 21.4
- The following additional graph editing options are now available in Graph Builder.
- Regression Fit can be added to Scatterplot and Matrix Plot.
- Percentile Lines can be added to Probability Plot.
- The Probability Plot Y-scale can be adjusted to Probability or Score, in addition
to Percent. - The scale on a Histogram can be adjusted to specify an interval type and an
interval definition.
- Additional analyses in Basic Statistics, Time Series, and Regression can be updated in the
output pane when data changes. - The Predictive Analytics Module now includes MARS® Regression.
Problems Resolved in Minitab 21.4
Desktop Application
- Minitab may crash when you try to conduct a 1-Sample t or 1-Sample Z on a column that is
empty. (185035) - Minitab may crash when you undo a graph edit that caused a warning or error to appear.
(196392) - The desktop application displays the incorrect product version under Help > About Minitab in all
non-English language versions. (186026)
Web Application
- Using the browser back button may cause the web application to lose its current session.
(194908) - You cannot see the Help, OK, or Cancel buttons in the graph gallery dialogs unless you scroll.
(196686) - The caution message that is displayed when you cut, delete, or clear data is unclear and not fully
translated. (198730)
Desktop and Web Application
- The Augmented Dickey-Fuller Test table is not properly formatted when sent to a report.
(202709)
- Probability Plot does not display error message when the chosen distribution is incompatible
with Scale type. (199707, 199712) - In Generalized Linear Model, the hierarchy check is incomplete when an interaction exists
between two nested terms. (178236) - When you edit an analysis with multiple graphs, the vertical scroll position of the Options pane
and the expand/collapse state of the accordion controls reset when you select a different graph.
(184583) - The Graph Options Pane may not reflect the current state of the graph with Undo/Redo.
(197667) - The test results for control charts are not included when sent to a report. (185189)
- Probability Plot does not display warnings when a distribution cannot be fit. (195154)
- The Graph Builder Histogram shows an incorrect tooltip in grouped cases. (196312)
- The Graph Builder Probability Plot tooltip is incorrect when a custom Y axis label is used.
(196540) - When you save a project that includes a Taguchi design with missing data in the factor column,
you cannot open the project later. (185777) - The Distribution Parameters table for the Graph Builder Histogram does not honor styling
Options that you set in the project. (197260) - An error may occur when you use Tables > Descriptive Statistics with data that includes missing
values. (200524) - The Parallel Coordinates Plot crashes when all missing columns are used. (201863)
An error is produced when you update an Individuals Chart with time scale reference lines.
(186009) - Minitab crashes when you paste formatted cells and additional columns in a new project.
(186094) - A Minitab project file created in version 21.3.1 cannot be opened in version 21.1.1. (186092)
- Minitab may crash when saving a project that includes a Z-MR chart. (205079)
- Minitab may crash if a hidden column is deleted, and then the Undo action is performed.
(205579) - The accuracy measures (MAPE, MAD, MSD) for Time Series models in the Portuguese version of
Minitab are inconsistent between the application and Help content. (182749)
Release Date: 8 December 2022
Minitab 21.3.1 provides important bug fixes.
Problems Resolved in Minitab 21.3.1
Desktop Application
- Dynamic Data Exchange (DDE) links within a project result in corrupted projects.
- (185924) Opening a Minitab project file within Minitab Engage® or Minitab Workspace® causes Minitab® Statistical Software to crash. (185903)
Desktop and Web Application
- Predictions from CART®, TreeNet®, Random Forests®, and Discover Best Model are incorrect when categorical predictors with single quotes in the levels are included in the model. (185948)
Release Date: 8 December 2022
Minitab’s Graph Builder now includes Interval Plot and Matrix Plot. For subscriptions that use the Minitab License Portal, the login experience has changed. Also, three optional add-on modules are now available for professionals who want guided analyses for the insurance industry, measurement system analysis, and sample size analysis.
New Features in Minitab 21.3
- The following interactive graphs are now available in Graph Builder.
- Matrix Plot
- Interval Plot
- Distribution Fit can now be added to Histogram in Graph Builder.
- Measurement System Analysis Module - This optional add-on module provides guided data analysis to solve all the most common MSA challenges. Get right to problem solving without worrying about which analysis to use.
- Sample Size Module - This optional add-on module help you to estimate the required sample size to assure you will have enough power to meet your needs.
- Insurance Module - This optional add-on module provides guided data analysis to solve common insurance industry challenges. Shift your focus to improving key performance indicators (KPIs) like Time to Settle a Claim, Revenue per Policy Holder, and Claims Ratios without worrying about which analysis to use.
Problems Resolved in Minitab 21.3
Desktop Application
- Users are unable to sign in to the Desktop application based on specific security policies set by their company. (PR184019) The Print Data Pane dialog is missing the OK button in German. (PR183949)
- Duplicating a Scatterplot with an overlaid model and scale transformation produces an error. (PR176146)
- Editing a Line Plot to show percent values then duplicating the graph creates a graph that does not match the original. (PR174159)
- A macro that includes a subroutine which includes the PPLOT command causes the application to crash. (PR182245) A macro that includes the command MTITLE causes performance issues on later runs. (PR185457)
- Copying and pasting data from Excel into a new Minitab worksheet causes an assertion failure. (PR185388)
- Selecting the Cancel button in the Graph Builder dialog can sometimes cause the application to crash in memory intensive use cases. (PR185031)
Web Application
- The application crashes when attempting to edit a Matrix Plot that was created via Graph Builder. (PR185721)
- The application crashes when a Dotplot is added to a Report. (187415)
- Some graph types that are set to auto update produce an error when an edit is applied to the graph twice. (192654)
Desktop and Web Application
- Individual value plots that display many outputs do not always display properly. (PR183109)
- In 2-Sample Poisson, Sample Rate values are incorrect in the output. (PR185333)
- In some cases, symbols with a Z value greater than ~200 do not appear on Contour Plots. (PR185614)
- A Minitab Online project that is opened in the desktop application displays copy and paste problems when the copied and pasted columns are hidden. (PR185697)
Release Date: 29 June 2022
Minitab Statistical Software has added Forecast with Best ARIMA Model, Augmented Dickey-Fuller Test, and Box-Cox Transformation to our Time Series features. Graph Builder now includes Line Plot, Stacked Area Graph, and Pie Chart and enhancements to Histogram and Time Series Plot. For compliance reasons, this software release also ensures that users on high school subscriptions cannot navigate to our website from within our apps (Minitab Statistical Software web, Minitab Statistical Software desktop, and License Portal).
New Features in Minitab 21.2
- There are three new features in the Time Series Menu
- Box-Cox Transformation
- Augmented Dickey-Fuller Test
- Forecast with Best ARIMA Model
- The following interactive graphs are now available in Graph Builder.
- Line Plot
- Pie Chart
- Stacked Area Graph
- Publish to Model Ops – From Minitab Statistical Software, directly publish a supported model to Model Ops by clicking the Publish to Model Ops button.
Problems Resolved in Minitab 21.2
Desktop Application
- In a concurrent License Portal subscription, closing the Minitab 20 desktop app without explicitly clicking "Sign Out", does not immediately release the seat. (183723)
- When you update a graph that has a different decimal separator than you are currently using, the update sometimes fails. (183729)
- Minitab crashes when a column with missing values is used with the Assistant Menu Graphical Analysis Main Effects Screener. (185406)
- In the graph Layout Tool window, the graph names listed in the list box are not synchronized with the graph names in the output pane’s Navigator. (179709)
- Resaving some large projects (for example, 1GB) can be problematic. (184713)
- In the Cox Regression dialog box, options in the Censor drop-down menu are omitted if the Censor column contains missing values. (185044)
- When you set Pareto and Half normal preferences under File Options, then create a General Full Factorial Design, an unexpected error occurs. (185273)
Web Application
- Adding a Dendrogram to a report causes Minitab to crash. (174330) The “Graph Options” menu is missing for Line Plot. (185042)
- The Analyze Factorial dialog box does not allow a center-point term when the design has center points. (184695) When you store standardized results in a named column, an error occurs. (184458)
- When you assign a formula from the right-click menu with a column name that contains “let”, an error occurs. (183540)
Desktop and Web Applications
- A categorical predictor that is not used to build the optimal tree in CART may be incorrectly listed as the most important variable in Relative Variance Importance Plot. (184330)
- An exception error occurs with Matrix multiplication in the Response Optimizer. (184721)
- A Run-Time Exception for Double Exponential Smoothing occurs with large amounts of data. (178441)
- If you run CART classification with a large amount of data, Minitab might crash. (184443)
- In the Terms sub-dialog box of Analyze Mixture Design, the Chinese translations for “linear” and “quadratic” are reversed for the mixture amount term order. (180734)
- In the Graph Builder, Bar Chart shows “Mean” for the function, but uses “Count” in the graph that is generated. (172218)
- The ability to create extreme vertices design (EVDESIGN) depends on the entry order of the components. (185225)
Release Date: 30 March 2022
Minitab Statistical Software now offers two optional add-on modules for professionals who want guided analyses for supply chain operations or customer contact centers.
New Features in Minitab 21.1.1
- Supply Chain Module – This optional add-on module allows users to shift focus to improving key performance indicators (KPIs) like cycle time, inventory, delivery, quality, profitability, and costs rather than worrying about which analysis to use.
- Customer Contact Center Module – This optional add-on module allows users to shift focus to improving key performance indicators (KPIs) like service levels, utilization and cost, ticket volume, time management, ticket resolutions, and customer satisfaction rather than worrying about which analysis to use.
Release Date: 27 October 2021
Our latest release, Minitab Statistical Software Version 21.1.0 is available to customers who manage their Minitab subscription in the Minitab License Portal. This release includes new features and bug fixes.
New Features in Minitab 21.1.0
- Automated Machine Learning (also known as AutoML) can now choose the right predictive analytics model for you through the Predictive Analytics Module
- Cox Regression techniques available in the Reliability/Survival menu
- Enhanced graph editing options and added Interactive Probability Plot in Graph Builder
This update is only available to customers who manage their Minitab subscription in the Minitab License Portal.
Problems Resolved in 21.1.0
- When you create a histogram, probability plot, or empirical CDF from the Graph menu and specify a distribution, Minitab may display an incorrect error, even if Data Options was used to exclude the portion of data that causes the error. (143049)
- If you use stepwise regression to analyze a mixture design with process variables, and one or more process variables are dropped by the stepwise procedure, the dropped process variables appear in the output with coefficients of zero. As a result, graphs of the model, including contour, surface, and optimization plots, show that the dropped process variables have no effect on the response, even though these variables were not included in the model. (9047)
- Creating a Minitab graph can crash Minitab if you have an outdated or incompatible video card driver. (6501)
- In rare circumstances, Minitab project files (*.MPJ, *.MPX) can become corrupt, and Minitab will be unable to open these files. (124217, 007128)
- In rare cases, customers have received the following error message when opening a project file: “An error has occurred while reading project file: MYFILENAME.MPX.” (8548, 8610, 8908)
- Graphs based on models with weights do not show as out-of-date if you modify the data in the weight column. (172888)
- When you open a text file (*.TXT), the Preview window may appear empty if the first 100 or more rows are empty or when you type a value of 100 or greater in First row to import. (175474)
- The Cancel button in the standard toolbar is not responsive with a slow running macro. (179705) WORKAROUND: Use the keyboard shortcut CTRL+Break.
- When you open a project in English that was created in a non-English language, the dialog boxes that you used will still appear in the non-English language. (179748)
- The legend for the Parallel Coordinates Plot may be incomplete until the graph is resized. (182566)
- If you send a large amount of output, such as a CART® Classification tree with many nodes, to Minitab Workspace™ or Companion by Minitab, these applications may crash. (182523)
- Intermittently, Send to Microsoft Word® does not send all output from Minitab to Microsoft Word® . (179956)
- In some cases, printing a Parallel Coordinates Plot from the command level context menu in the Output Pane may not work and may prevent printing at the command level for other commands. (182664)
- If the internet is disconnected when you work with a project in an online repository (Microsoft OneDrive® or Google Drive™), the project in the repository may remain locked. WORKAROUND: In the online repository, check in the project or discard the check out. (182648)
- To share Google Drive™ projects in Microsoft Edge®, change Tracking Prevention to Basic in the Microsoft Edge® privacy settings. (182646)
- To open worksheets (mtw and mwx) in the web version of Minitab when using Microsoft OneDrive®, you must use File > Open > Worksheet. You cannot open worksheets directly from Microsoft OneDrive®. (182652)
- Item 17 In the web version of Minitab, you cannot copy CART® tree diagram items from the context menus when you use Safari ®. (182654) WORKAROUND: Select the tree diagram and use Command+C. 5
- If you use comma decimal separator regional settings (German, Portuguese, French) in the web version of Minitab, you are not able to use the Response Optimizer. (182656)
- When you share Minitab projects through email, the recipient can only download the project and not open it directly in the web version of Minitab. (182658)
- When you create a project in Minitab 21 that contains a CART® model that includes the Relative Variable Importance Chart, you will not see any of the CART® output associated with that model when you open the project in Minitab 19.2020.1, 20.1, 20.1.2, or 20.1.3. (183463)
- Binned Scatterplots in the Graph Builder do not display on Virtual Machines. (183779)
- Google Sheets™ cannot be opened in the Minitab Desktop app. (183963)
- In the Minitab web app, commands that take longer than 4 minutes to complete will time out or result in an expired session. (184221)
- Users who are licensed through the Minitab License Portal using Single Sign-on and Multi-Factor Authentication cannot sign into the Desktop app on Microsoft Windows 8.1. (184362)
- Opening a project from a repository (Microsoft OneDrive® and Google Drive™) will cause the Desktop app to crash on Microsoft Windows 8.1. (184364)
- If a system reboot is pending and you attempt to install Minitab, the installation produces a warning that a reboot pending. (184507) WORKAROUND: Reboot your machine and then install Minitab.
- If a system reboot is pending and a Healthcare Module user installs Minitab 21, the module does not display in the Desktop version of Minitab. (184507)
Minitab 20 Full Update Notes
Release Date: 8 September 2021
Minitab Statistical Software has been updated to include an additional visualization, Bubble Plot, in Graph Builder. This update is also compatible with Minitab’s Healthcare Module, our optional add-on purpose built with healthcare professionals in mind.
New Features in Minitab 20.4
- Interactive Bubble Plot available in Graph Builder.
- Healthcare Module - This optional add-on module includes statistical analyses and graphs using common Key Process Indicators (KPIs) in the healthcare industry.
Problems Resolved in Minitab 20.4
- When you create a histogram, probability plot, or empirical CDF from the Graph menu and specify a distribution, Minitab may give an incorrect error, even if Data Options was used to exclude the portion of data that causes the error. (143049)
- If you use stepwise regression to analyze a mixture design with process variables, and one or more process variables are dropped by the stepwise procedure, the dropped process variables appear in the output with coefficients of zero. As a result, graphs of the model, including contour, surface, and optimization plots, show that the dropped process variables have no effect on the response, even though these variables were not included in the model. (9047)
- Creating a Minitab graph can crash Minitab if you have an outdated or incompatible video card driver. (6501)
- In rare circumstances, Minitab project files (*.MPJ, *.MPX) can become corrupt, and Minitab will be unable to open these files. (124217, 007128)
- In rare cases, customers have received the following error message when opening a project file: “An error has occurred while reading project file: MYFILENAME.MPX.” (8548, 8610, 8908)
- Graphs based on models with weights fail to show as out-of-date if the weight column is updated. (172888)
- When opening a text file (*.TXT), the Preview window may appear empty if the first 100 rows or more are empty or when you type a value of 100 or greater in First row to import. (175474)
- The cancel button in the standard toolbar is not responsive with a slow running macro. (179705)
- The Parallel Coordinates Plot legend may be incomplete until the graph is resized. (182566)
- If you send a large amount of output, such as a CART® Classification tree with many nodes, to Minitab Workspace™ or Companion by Minitab, these applications may crash. (182523)
- If you hold your mouse down and drag off the bottom edge when you click on a submenu, Minitab may crash. (182604)
- Intermittently, the XWORD command does not send all output from Minitab to Microsoft Word® . (179956)
- Printing a Parallel Coordinates Plot from the command level context menu in the Output Pane may not work in some cases, which may prevent printing at the command level for other commands. (182664)
- If the internet is disconnected when you are working with a project in an online repository (Microsoft OneDrive® or Google Drive™), the project in the repository may remain locked. You will need to go to the online repository to check it in or discard the check out. (182648)
- To share Google Drive™ projects in Microsoft Edge® , you need to change Tracking Prevention to Basic in the Microsoft Edge® privacy settings. (182646)
- To open worksheets (mtw and mwx) in the web version of Minitabwhen using Microsoft OneDrive® , you must use File > Open Worksheet. You cannot open worksheets directly from Microsoft OneDrive® . (182652)
- In the web version of Minitab, you cannot copy CART tree diagram items from the context menus when you use Safari ® . (182654)
- If you use comma decimal separator regional settings (German, Portuguese, French) in the web version of Minitab, you will not be able to use the Response Optimizer. (182656)
- When you share Minitab projects through email, the recipient can only download the project and not open it directly in the web version of Minitab. (182658)
- When you create a project in Minitab 20.2 that contains a CART model that includes the Relative Variable Importance Chart, you will not see any of the CART output associated with that model when you open the project in Minitab 19.2020.1, 20.1, 20.1.2, or 20.1.3. (183463)
- In the Minitab web app, subsetting a worksheet based on a date returns an error. (183268)
- Creating Binned Scatterplots with X-Y Pairs may generate incorrect graphs when the pairs of columns have unequal lengths. (183631)
- Binned Scatterplots render empty in the Graph Builder on Virtual Machines. (183779) WORKAROUND: Check the “Disable hardware acceleration” checkbox in File > Options > Graphics > Other Graphics Options.
- Google Sheets™ cannot be opened in the Minitab Desktop app. (183963)
- In the Minitab web app, commands that take longer than 4 minutes to complete will time out or result in an expired session. (184221)
- Users who are licensed through the Minitab License Portal using Single Sign-on and Multi-Factor Authentication cannot sign into the Desktop app on Microsoft Windows 8.1. (184362)
Release Date: 23 June 2021
Minitab Statistical Software has been updated to include Graph Builder, a new way to revisualize your data and explore graph alternatives with an interactive and easy-to-browse gallery.
New Features in Minitab 20.3
- Graph Builder that allows you to visualize your data and explore graph alternatives. The following graphs are available in Graph Builder.
- Bar Chart
- Binned Scatterplot
- Boxplot 5
- Correlogram
- Heat Map
- Histogram
- Individual Value Plot
- Parallel Coordinates Plot
- Scatterplot
- Time Series Plot
Problems Resolved in Minitab 20.3
- Minitab uses an incorrect n value for the Larger is better signal-to-noise ratio when you analyze a Taguchi design with missing values for the response variable. (182578)
- Macro won't store values until ENDMTITLE is issued. (181525)
- In the web app, you cannot enter continuous predictors in Response Optimizer. (183687)
- Depending on the order of the variables for Binned Scatterplot, the calculation may be incorrect. (183631)
- In the web app, deleting columns with an empty column in between does not work correctly. (183532)
Release Date: 13 April 2021
This update includes additional visualizations, integrations and general improvements.
New Features in Minitab 20.2
- Predictive Analytics Module – The Predictive Analytics Module is an add-on feature that gives permitted users access to advanced predictive analytics methods:
- TreeNet® Classification
- Random Forests® Classification
- TreeNet® Regression
- Random Forests® Regression
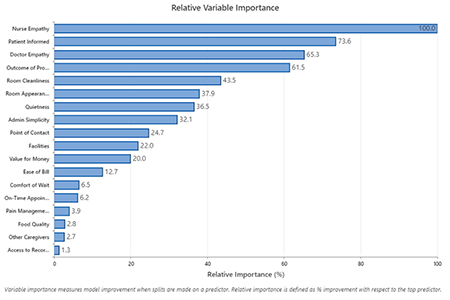
- Relative Variable Importance Chart update in CART – The new chart allows for scrolling when the data include many predictors.
- Correlogram – This new graph allows users to visually compare the Pearson correlation coefficients between each pair of variables.
- Heatmap – The Heatmap dialog box has been updated to provide a new display option and allow users to create multiple graphs at once.
- Binned Scatterplot – The Binned Scatterplot dialog box has been updated to allow users to create multiple graphs at once using each Y versus each X or specific X/Y pairs.
- Parallel Coordinates Plot – The Parallel Coordinates Plot dialog box has been updated to allow users to create multiple graphs at once.
- Lag under the Time Series menu – The enhanced lag functionality allows users to have multiple root columns and to generate and store multiple lag columns.
- Social Login – The social login feature allows users with Minitab License Portal licensing to sign into their account with Facebook or Google.
- R Integration – The integration with R allows users to extend the functionality provided by Minitab Statistical Software for the desktop version only. Note: The validation kit has been updated for 20.2.
Problems Resolved in Minitab 20.2
- Editing a graph that allows crosshairs in split view crashes Minitab. (181835)
- If you delete a graph and then change the graphed data when Automatic Updates are on and then undo both the graph deletion and the data change, Minitab crashes. (182286)
- Certain Taguchi Designs become corrupt. (182239)
- Unable to save a project when the file path includes an apostrophe. (182922)
- User notes are removed when results are updated after data change. (181983)
- The V-mask CUSUM chart cannot be updated after data change. (181988)
- Control charts with multiple columns will crash on save after an update. (183065)
- Unable to open XLSX files downloaded from Google Sheets™. (183103)
- The Recode > Use Conversion Table dialog box in the web app requires the same number of rows for the input column and the conversion table. (182138)
- Capability Sixpack produces an error when a subgroup contains a missing value. (181201)
- Using a mix of straight and curly quotes with the TSET command can crash Minitab. (181845)
- In some instances, user can be blocked from opening Google Drive™ documents through the desktop app. (183000)
- In the Minitab web app, users may get a syntax error in dialog boxes when you use regional settings other than English. (183115)
Release Date: 28 January 2021
Minitab 20.1.3 provides a bug fix to address a launch issue that occurred with some specific network configurations.
Release Date: 16 December 2020
Minitab 20.1.2 provides bug fixes for licensing and automation functionality (COM).
Problems Resolved in Minitab 20.1.2
- To use COM, users with License Portal licensing are required to launch the Minitab Desktop application, sign in, and check “Keep me signed in”. (182788)
- Users with License Portal licensing who attempt to sign out while in offline mode do not receive a warning message that they are offline. (182702)
- If a user with License Portal licensing signs out while a Repository project is open, the Repository project remains locked. (182705)
- When a License Portal user signs out of the Desktop application, the seat is not immediately released. (182708)
- The location of the Six Sigma Toolbar is reset every time the Desktop application is launched. (182715)
Minitab 19 Full Update Notes
Release Date: 12 November 2020
Minitab 19.2020.2 provides bug fixes and important compatibility updates for macOS 11 Big Sur.
Release Date: 7 April 2020
This update includes our proprietary CART® (Classification Trees and Regression Trees) commands which expand upon Minitab’s predictive analytics capabilities to better enable you to proactively make decisions and take actions that create value by delivering better results and avoiding costly mistakes.
New Features in Minitab 19.2020.1
- CART® Classification and Regression – These new commands illustrate patterns and relationships between a categorical or continuous response and important predictors within highly complicated data.
- Cross-Validation for Regression – You can now validate models using K-fold crossvalidation or validation with a test set.
- Cross-Validation for Binary Logistic Regression o You can now validate models using validation with a test set.
- You can now create a Receiver Operating Characteristic (ROC) Curve as part of the output.
- The original Multi-Vari Chart for up to four factors is available again.
- Interface Improvements
- Graphs have updated styling.
- The graph editing window now has a maximize button.
- You can resize the Command line pane.
- The new Additional Tools menu includes links to Quality Trainer® and Minitab Workspace™.
- Integration with Python
- Performance Improvements
Problems Resolved in Minitab 19.2020.1
- Graphs display as a black box. (179903)
- Minitab crashes if you edit a note and go to File > New Project while in edit mode. (181543)
- Users are unable to access Online Help depending on their environment. (180937) Windows only fixes
- Syntax error in a DO statement in a global or local macro closes Minitab. (180294)
- When you choose Analyze Binary Response, Minitab 19 with Chinese Language crashes instead of displaying an error. (180007) Mac only fixes
- When the grouping separator (thousands separator) is not set on the Operating System, no output displays in the Output pane. (180840)
Get the Update
- Open the Minitab Desktop app.
- Choose Help > Check for Updates.
- Follow the instructions for installing Minitab.
If you experience difficulty updating Minitab Statistical Software, please contact Minitab Technical Support for assistance.