- New Features & Enhancements
- Full Update Notes
Minitab Solution Center Features & Enhancements
The March 2026 Release of the Minitab Solution Center includes enhancements, important bug fixes, and security updates.
Minitab Solution Center
Minitab DOE by Effex
User Benefit
Minitab DOE by Effex features OMARS® (Orthogonal Minimally Aliased Response Surface) designs that combine screening and response surface methods. This approach helps teams build more accurate predictive models, estimate effects more clearly, and gain deeper insights with fewer experimental runs. By reducing the number of runs required while improving model quality, Minitab DOE by Effex can help you save time, lower costs, and make more confident data-driven decisions.
Summary
Minitab DOE by Effex is now available through the Minitab Solution Center to expand your design of experiments (DOE) capabilities. To add Minitab DOE by Effex to your Minitab subscription, contact your Minitab representative.
Minitab Data Center
AI Calculated Column Creation
User Benefit
Minitab AI automatically generates the appropriate formula and eliminates the need to write equation syntax or search through function libraries. The result is faster data preparation with less manual effort and fewer errors.
Summary
Use Minitab AI to create calculated columns by simply describing the transformation you want in plain language.
The February 2026 Release of the Minitab Solution Center includes enhancements, important bug fixes, and security updates.
Minitab Web App
Minitab AI for Guided Assistance
User Benefit
Use the new conversational interface to get suggestions and insight into identifying the most suitable tools in Minitab for analyzing your data and answering your questions. Minitab AI ensures your problem is well-scoped by asking targeted clarifying questions and provides clear explanations for accomplishing data analysis tasks.
Summary
Minitab Statistical Software web app now offers interactive, AI-powered guided assistance for navigating the Minitab interface, selecting appropriate statistical tools and methods, and interpreting results. This powerful, new AI integration helps to quickly identify the most effective analyses and visualizations for your data, allowing you to uncover insights even faster.
Dialog Box Variable Filter
User Benefit
Use the new filter control to identify and select variables into dialog input boxes that accept a worksheet column more quickly and efficiently.
Summary
When you select a dialog box item that accepts a column, the dialog provides a list of available columns in the worksheet. You can enter text in Filter variables box above the list of columns to filter the columns by name.
Minitab Dashboards
KPI Asset Enhancements
User Benefit
You can now spotlight KPIs with color-based formatting when thresholds are violated and also fine-tune precision by controlling displayed decimal places.
Summary
The KPI Asset now offers additional formatting and display options, including precise decimal control, text size and alignment options, and color settings. In addition to color customization, conditional formatting capabilities have also been introduced to automatically change color and display descriptive labels when thresholds are violated.
Minitab Workspace
Custom Templates
User Benefit
Minitab Workspace now lets you customize project, map, and brainstorm templates and share all customized templates, giving you ready-to-use starting points for every project. Reuse proven structures, keep teams aligned, and reduce errors by standardizing work around your organization’s processes and terminology.
Summary
You can now create and share reusable custom templates in Workspace, allowing your team to quickly start new projects and tools with consistent, organization-specific processes and terminology.
The November 2025 Release of the Minitab Solution Center includes enhancements, important bug fixes, and security updates.
Minitab Web App
Export Worksheet Data
User Benefit
In the Minitab web app, you can now right-click on a worksheet tab and choose “Export Worksheet” to export worksheet data to a file in your preferred cloud repository or to your Downloads folder when not signed into a repository. You can choose the type of file to export, which includes Minitab Worksheet (.mwx), Excel Spreadsheet (.xlsx), comma-separated values (.csv), or plain text (.txt).
Summary
Individual worksheets in the Minitab web app can now be exported in a separate file from the saved Minitab Project file.
Gage R&R Studies Support VDA 5 Standards
User Benefit
Minitab’s Gage R&R Studies (including Crossed, Nested, and Expanded) now support the German Automotive Industry Association’s VDA 5 Standards, which focus on uncertainty-based approaches to Measurement Systems Analysis and provides guidelines for ensuring the capability and suitability of measuring systems in industrial manufacturing environments, particularly in automotive sectors.
Summary
Gage R&R Studies now provide support for uncertainty calculations outlined in the VDA 5 standards.
Enhanced Graph Builder Editing of Reference Line and Percentile Line Labels
User Benefit
You can now modify the number of decimal places that Minitab displays by default for numeric reference line and percentile line labels on graphs produced from the Graph Builder by accessing the Options pane from the graph context menu.
Summary
Reference line and percentile line label precision editing is now available in the Options pane for graphs produced from Graph Builder.
Minitab Brainstorm
Brainstorm with colleagues in real time
User Benefit
You can now work with your colleagues in Minitab Brainstorm to generate and organize your ideas in real time.
Summary
Multiple users can now actively collaborate in the same Minitab Brainstorm file and see all changes in real time.
Minitab Dashboards
Minitab AI-Powered Automatic Dashboard Generation
User Benefit
Minitab Dashboards now offers an AI-powered automatic dashboard generation feature that helps customers with selecting the right visualizations or identifying key insights for their dashboard project. This capability leverages artificial intelligence and statistical best practices to analyze structured dataset metadata, automatically identify the most suitable visualizations, and generate a recommended set of assets for an effective dashboard.
Summary
Minitab AI has been incorporated into the Minitab Dashboards solution that will automatically generate a recommended set of visualizations from a particular data source as an initial first step in building an effective dashboard.
Minitab Data Center
Minitab AI Integration
User Benefit
Harness the power of Minitab AI in the Data Center to streamline your data preparation and enhance your efficiency in cleaning data.
Summary
When cleaning your data, use the new conversation interface to request specific data cleansing operations. Minitab Al creates and executes the necessary steps, then displays them in the Steps panel. If modifications are necessary, edit or delete them from the Steps panel or continue using the Minitab AI chat prompt.
Data Pipeline Diagram
User Benefit
Use the new data pipeline diagram to easily switch between the Data Source and Cleanup views of your data set.
Summary
In preparation for introducing more complex data transformation into the Minitab Data Center, the current interface has been simplified. From the Data Source view, specify the data set options and the schema. From the Cleanup view, easily access Minitab AI and all column cleaning steps. Both views are helpful to gain insight into your data.
Online Repositories
Minitab Connect® Integration
User Benefit
You can now utilize any of the data from your Minitab Connect® subscription within any of the Minitab Solution Center apps.
Summary
Extend your reach even further by bringing in data from databases, file servers, REST endpoints and more, with your Minitab Connect® subscription. After these pipelines are configured within Minitab Connect®, select the corresponding tables and views to use as data sources for your project files.
The September 2025 Release of the Minitab Solution Center includes enhancements, important bug fixes, and security updates.
Minitab Web App
Response Optimization in the Predictive Analytics Module
User Benefit
Response Optimization is a powerful tool for leveraging predictive models to achieve specific goals by strategically adjusting the settings of your input or predictor variables for an optimal response. This can lead to increased efficiency, enhanced performance, better understanding of your process or outcome, and improved decision-making.
Summary
After creating a predictive model for a single response using TreeNet®, Random Forests®, or MARS®, you can now choose Response Optimizer from the toolbar positioned at the top of the model results. A new, interactive Optimization Plot can also be created to interactively determine the optimal settings for predictor variables that will lead to a desired outcome or response value.
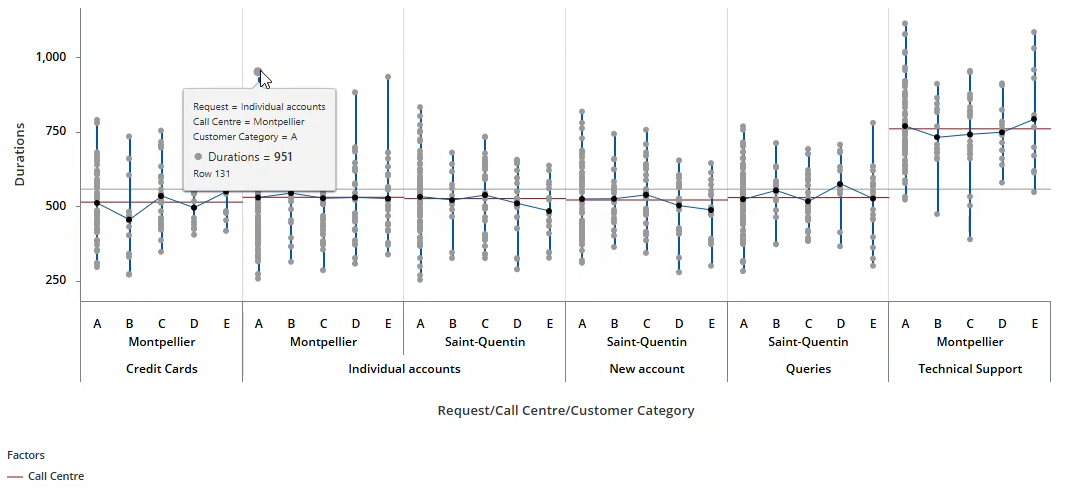
Interactive Variability Chart in Graph Builder
User Benefit
Variability Chart is a simple and intuitive tool to visualize different sources of variation in your data in a single diagram and to better understand the relationships between factors and responses. A new, interactive version of this chart is now available in Graph Builder.
Summary
An interactive Variability Chart is now included in the Graph Builder to visualize sources of variation and identify patterns between factors and a response.
Enhanced Graph Builder Editing of Labels
User Benefit
You can now modify the number of decimal places that Minitab displays by default for numeric axis tick labels and Y-value data labels on graphs produced from the Graph Builder by accessing the Options pane from the graph context menu.
Summary
Graph label precision editing is now available in the Options pane for graphs produced from Graph Builder.
Gage Studies Support VDA 5 Standards
User Benefit
Minitab’s Type 1 Gage Study now supports the German Automotive Industry Association’s VDA 5 standards, which focus on uncertainty-based approaches to Measurement Systems Analysis and provides guidelines for ensuring the capability and suitability of measuring systems in industrial manufacturing environments, particularly in automotive sectors.
Summary
Type 1 Gage Study now provides support for uncertainty calculations outlined in the VDA 5 standards.
Minitab Dashboards
Data Table Asset
User Benefit
You can now enhance your Minitab Dashboard by adding a table view of your source data alongside your analytics and visualizations. This table view will dynamically respond to dashboard slicers and will be updated as new source data are added.
Summary
A data table is now included as an available asset to include in a dashboard, which provides a view of source data alongside other dashboard analytics and visualizations.
Minitab Data Center
Minitab Data Center Project File (.MDCX)
User Benefit
You can now save open Minitab Data Center planes as project files using the Export dialog. Project files make it easier to pick up where you left off and provide a consistent starting point when using the same data connection across multiple analyses or dashboards.
Summary
A MDCX file is a specialized project file for the Minitab Data Center. This file captures the complete configuration of your Data Center session, including source file metadata, read options, initial cleanup settings, and all preparation steps.
Online Repositories
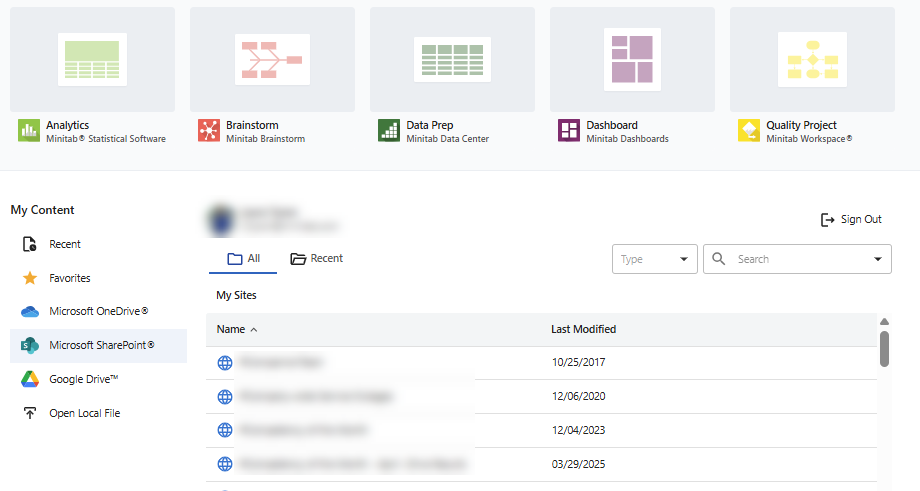
SharePoint Integration
User Benefit
In addition to Microsoft OneDrive® and Google Drive™, users can navigate to Microsoft SharePoint® to open files within the Minitab Solution Center.
Summary
From the Minitab Solution Center home page, users can sign in to Microsoft SharePoint to open files stored on SharePoint sites.
The July 2025 release of the Minitab Solution Center includes enhancements, important bug fixes, and security updates.
Minitab Statistical Software Web App
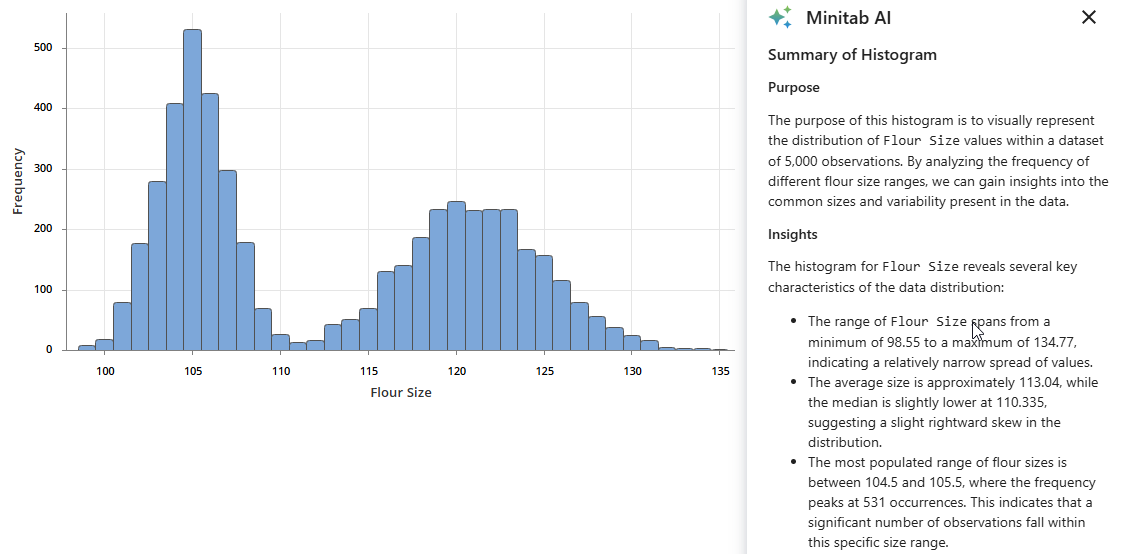
Expanding Minitab AI Summaries for Graph Builder Graphs
User Benefit
For several graphs created from Graph Builder, you can now use Minitab AI to provide a natural language summary of the visualization to help you better understand patterns or trends as well as anomalies in your data.
Summary
Minitab AI summaries are now available for the following Graph Builder graphs: Histogram, Boxplot, Bar Chart, Pie Chart, and Pareto Chart. We will continue to expand the AI summaries for more graphs in subsequent releases.
Variability Chart Enhancements
User Benefit
For Variability Chart in Quality Tools, you can now enter one or more categorical By variables to create a separate Variability Chart for each category level for comparison. You also can request a log-10 transformation to the Y-scale of the Means chart when you graph the variability of response data across different factors that are highly skewed or affected by severe outliers.
Summary
Variability Chart now supports By variables and an option to apply a log-10 transformation on the Y-scale of the Means chart.
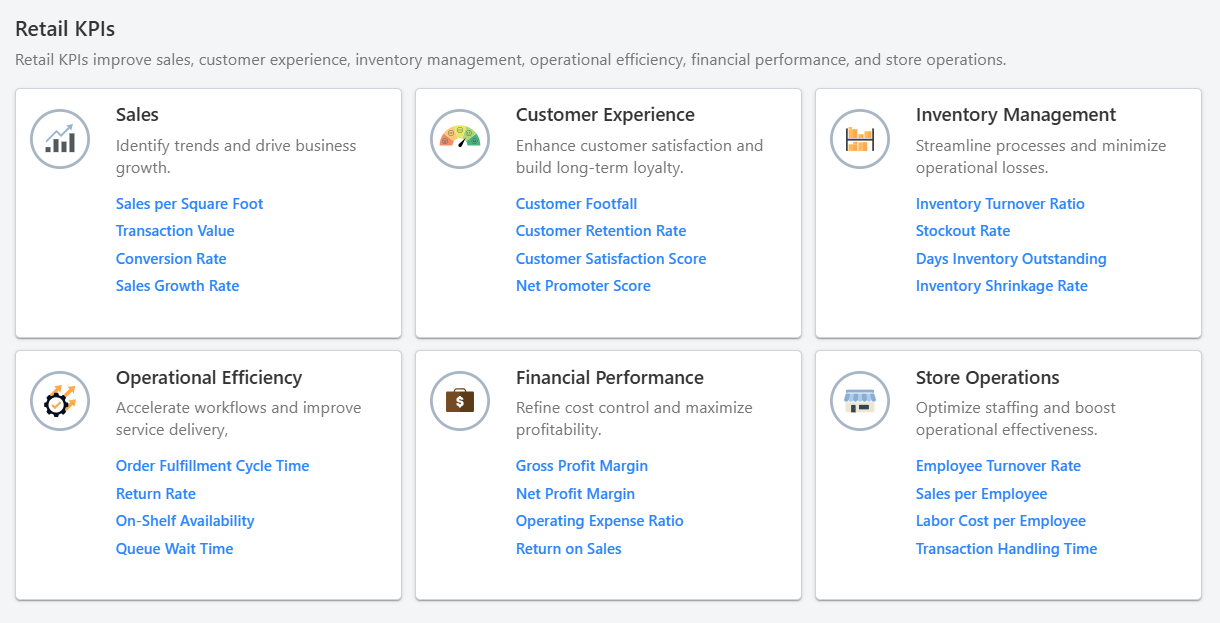
New Modules for Transportation and Retail Industries
User Benefit
Professionals in the transportation and retail industries now have access to add-on modules.
Summary
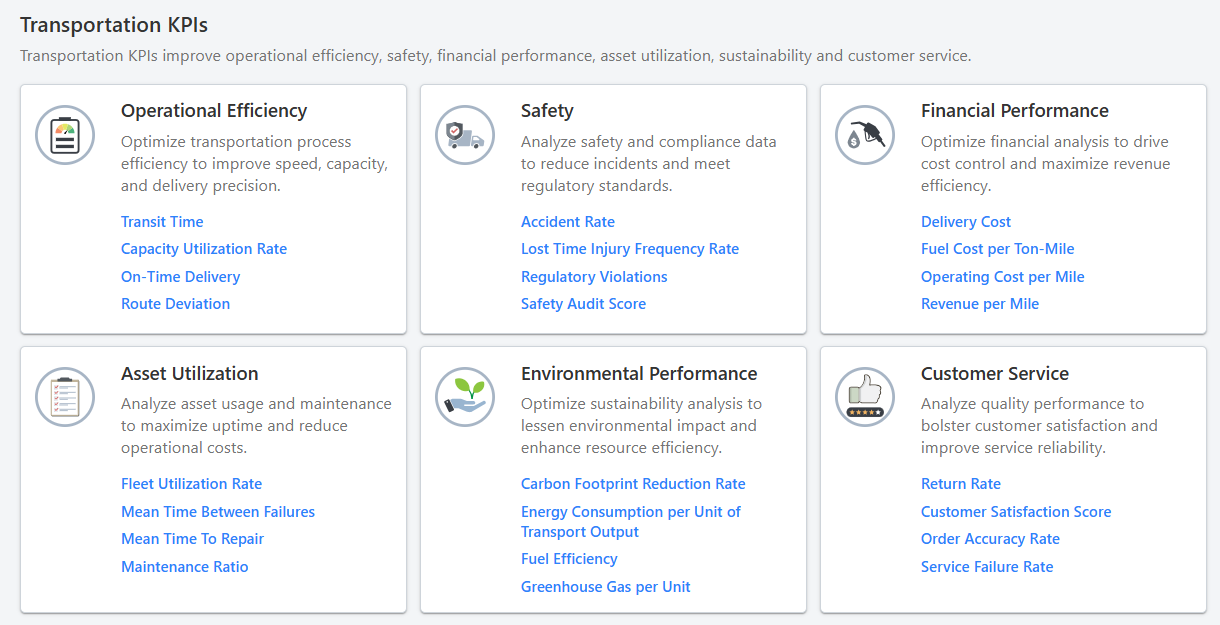
The Transportation Module helps transportation professionals quickly get started with data analysis to reduce transit time and analyze key performance indicators (KPIs) related to operational efficiency, asset utilization, safety, environmental performance, financial performance and customer service.
The Retail Module helps retail professionals quickly get started with data analysis, from increasing sales to analyzing key performance indicators (KPIs) related to customer experience, inventory management, operational efficiency, financial performance, store operations and sales.
Minitab Dashboards
Copy and Remap Dashboard Assets
User Benefit
To facilitate the reuse and reapplication of established Dashboards to different data sources, we have added the ability to copy/paste dashboard assets and remap their source inputs.
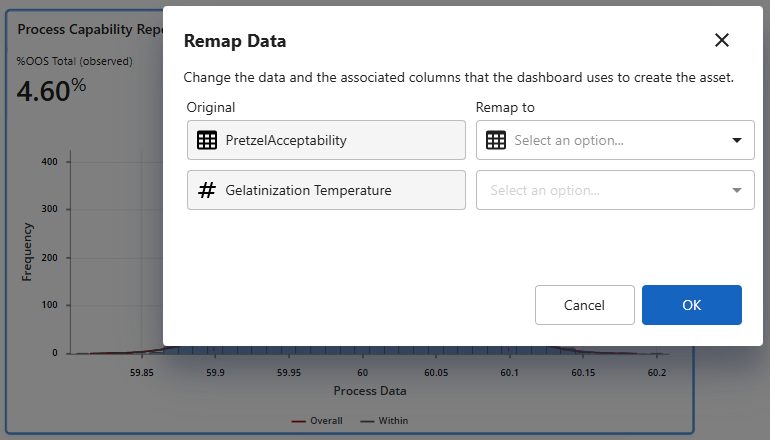
Summary
In Minitab Dashboards, you can now copy and paste existing dashboard assets and remap to a different data source.
Minitab Workspace
Add linked files to your project
User Benefit
Users can now quickly access external files directly from their Workspace projects by adding linked files. Add links to a variety of files, including documents, presentations, spreadsheets, images, and any file created in the Minitab Solution Center.
Summary
Users can now add links to external files in their Workspace projects.
Minitab Data Center
Calculated Column
User Benefit
Users may now implement a variety of calculation-based data preparation steps.
Users can now leverage common mathematical functions, leveraging similar syntax from Minitab Statistical Software’s Calculator, to produce new columns of data.
Summary
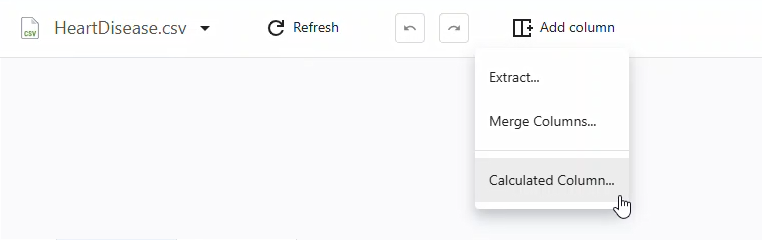
Create new columns of data based on custom equations using hundreds of predefined mathematical functions, including common arithmetic, date/time, text, and statistical functions.
Online Repositories
Recent and Favorite Files
User Benefit
Users can now quickly access files that they recently opened or marked as favorites.
Summary
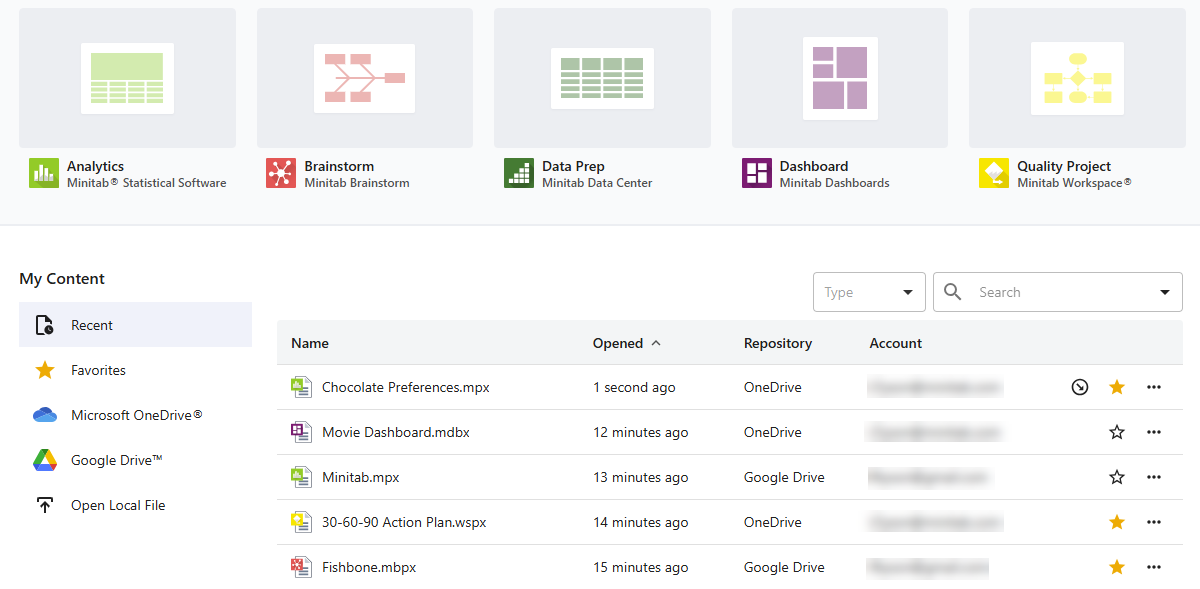
In the repository section of the landing page, access the files you need quickly and efficiently by viewing recently accessed files or by marking files as favorites. Both sections display recent and favorite files across your repositories (Microsoft OneDrive® and Google Drive™).
The May 2025 Release of the Minitab Solution Center includes enhancements, important bug fixes, and security updates.
Minitab Data Center: Split and Extract
User Benefit
Use the new Split and Extract data cleanup operations to create new columns of data based on a subset of characters/strings from other Text Columns.
Summary
The Split and Extract data preparation steps allow you to subdivide the values within a text column, in order to pull out specific characters, strings, or list items. The Extract function provides more granular methods for parsing values that allows you to create one new column at a time, while the Split function caters to list values that can create up to 10 new columns at a time.

Minitab Dashboards: Enhanced Menus, Multiselect, and Zoom
User Benefit
When creating and editing a Dashboard, use the enhanced asset context menus as well as the multiselect capability to quickly build and organize the layout of your dashboard. And the new zoom feature allows you to more easily navigate across larger canvases.
Summary
Actions specific to sourcing and editing dashboard assets are now available in the enhanced context menu at the top-right corner of each asset. Multiple assets can be simultaneously selected for purposes of moving, deleting, and reorganizing the dashboard layout. And a native zoom control can be used to help navigate larger dashboards.
Minitab Solution Center Full Update Notes
Release Date: 25 March 2026
New Feature in Minitab Solution Center
Minitab DOE by Effex Is Now Available in the Minitab Solution Center
Minitab DOE by Effex is now available through the Minitab Solution Center to expand your design of experiments (DOE) capabilities.
Minitab DOE by Effex features OMARS® (Orthogonal Minimally Aliased Response Surface) designs that combine screening and response surface methods. This approach helps teams build more accurate predictive models, estimate effects more clearly, and gain deeper insights with fewer experimental runs. By reducing the number of runs required while improving model quality, Minitab DOE by Effex can help you save time, lower costs, and make more confident data-driven decisions.
To add Minitab DOE by Effex to your Minitab subscription, contact your Minitab representative
New Features in Minitab Statistical Software
Enhanced AI Feedback
Minitab Statistical Software now includes an enhanced feedback system for AI features. You can provide targeted input on content that is helpful as well as areas that are in need of improvement. This feedback will help refine AI capabilities to ensure they deliver accurate, meaningful insights.
Minitab AI Summaries
Minitab AI summaries are now available for Matrix Plot and Binned Scatterplot in Graph Builder.
New Features in Minitab Dashboards
Dialog Variable List Filter
Use the new filter control to more quickly and efficiently identify and select variables into dialog input boxes that accept a worksheet column.
Folded Normal Distribution
You can now fit a folded normal distribution in Nonnormal Capability.
New Feature in Minitab Data Center
AI Calculated Column Creation
Use Minitab AI to create calculated columns by simply describing the transformation you want in plain language. Minitab AI automatically generates the appropriate formula and eliminates the need to write equation syntax or search through function libraries. The result is faster data preparation with less manual effort and fewer errors.
Release Date: 11 February 2026
Minitab Solution Center Interface Update
The application frame has been modified to distinguish global and project specific controls. Global and project navigation is now part of the header bar, and the left application rail is reserved for project-specific actions.
New Features in Minitab Statistical Software
AI-Power Guided Assistance
Minitab Statistical Software web app now offers interactive, AI-powered guided assistance for navigating the Minitab interface, selecting appropriate statistical tools and methods, and interpreting results. This powerful, new AI integration helps to quickly identify the most effective analyses and visualizations for your data, allowing you to uncover insights even faster.
Filtering in Dialog Boxes
When you select a dialog box item that accepts a column, the dialog provides a list of available columns in the worksheet. You can enter text in Filter variables box above the list of columns to filter the columns by name.
Problems Resolved in Minitab Statistical Software
Password protected files are not unlocked as expected. (316790)
Unintended behavior occurs when you apply the MTITLE option to a tree diagram in CART® models. (281668)
Connect line in scatterplot does not correctly connect points. (315194)
New Feature in Minitab Dashboards
The KPI Asset now offers additional formatting and display options, including precise decimal control, text size and alignment options, and color settings. In addition to color customization, conditional formatting capabilities have also been introduced to automatically change color and display descriptive labels when thresholds are violated.
Problem Resolved in Minitab Dashboards
The dashboard shows an error indicating that the maximum number of data views has been exceeded, even though the customer has fewer than 100 linked views. (314111)
New Feature in Minitab Workspace
Minitab Workspace now lets you customize project, map, and brainstorm templates and share all customized templates, giving you ready-to-use starting points for every project. Reuse proven structures, keep teams aligned, and reduce errors by standardizing work around your organization’s processes and terminology.
Release Date: 10 December 2025
New Features in Minitab Web App
- Minitab AI summaries are now available for the following graphs:
- Probability Plot
- Tabulated Statistics
- Bubble Plot
- Scatterplot
- Large data values (-1e30, 1e30) are now allowed in worksheets.
- You can now fit a folded normal distribution in Nonnormal Capability Analysis and Nonnormal Capability Sixpack.
New Features in Minitab Dashboards
- You can now add Wafer plot and Variability Charts to Dashboards.
- Usability Enhancements were made, including:
- The properties pane indicates when multiple items are selected.
- The "Remap Data" label was updated to "Change Data Connection."
- The page navigator is now available next to the Dashboard title in both Present and Edit modes.
Problem Resolved in Minitab Dashboards
Unintended behavior occurs when a user selects “Open Dialog” to modify an Individuals Chart. (305043)
Release Date: 6 November 2025
New Features in Minitab Web App
Enhanced Graph Builder Editing of Reference Line and Percentile Line Labels
You can now modify the number of decimal places that Minitab displays by default for numeric reference line and percentile line labels on graphs produced from the Graph Builder by accessing the Options pane from the graph context menu.
Export Worksheet Data
In the Minitab web app, you can now right-click on a worksheet tab and choose “Export Worksheet” to export worksheet data to a file in your preferred cloud repository or to your Downloads folder when not signed into a repository. You can choose the type of file to export, which includes Minitab Worksheet (.mwx), Excel Spreadsheet (.xlsx), comma-separated values (.csv), or plain text (.txt).
Gage R&R Studies Support VDA 5 Standards
Minitab’s Gage R&R Studies (including Crossed, Nested, and Expanded) now support the German Automotive Industry Association’s VDA 5 Standards, which focus on uncertainty-based approaches to Measurement Systems Analysis and provides guidelines for ensuring the capability and suitability of measuring systems in industrial manufacturing environments, particularly in automotive sectors.
Problems Resolved in Minitab Web App
- The web app opens .txt and .csv files by default. (302962)
- A global macro that does not include a semicolon performs in an unexpected way. (303480)
- Nonlinear Regression in a local macro causes unintended behavior. (296239)
- The dialog for Chi-Square Goodness-of-Fit test exhibits unintended behavior. (187706)
New Features in Minitab Brainstorm
Multiple users can now actively collaborate in the same Minitab Brainstorm file and see all changes in real time.
New Features in Minitab Data Center
Minitab AI Integration for Data Prep
The new Minitab AI feature provides a conversational interface that guides and streamlines data preparation steps as an alternative to navigating column menus. Use the AI prompt to request specific data cleansing operations, then Minitab Al generates the necessary steps, and displays them in the Steps panel.
Data Pipeline Diagram with Data Source and Cleanup Nodes
Use the new data pipeline diagram to easily switch between the Data Source and the Cleanup views of your data set. Use the Data Source view to specify the data set options and the schema. Use the Cleanup view to access Minitab AI and all column cleaning steps
New Features in Minitab Dashboards
AI-powered automatic dashboard generation
Users can now leverage artificial intelligence and statistical best practices to analyze structured dataset metadata, automatically identify the most suitable visualizations, and generate a recommended dashboard layout.
Release Date: 8 October 2025
New Features in Minitab Statistical Software
- Minitab AI summaries are now available for the following graphs.
- Individual Value Plot
- Interval Plot
- Stacked Area Graph
- Time Series Plot
Problems Resolved in Minitab Statistical Software
- Factorial DOE behaves inconsistently in certain situations.
- The .mwx file name extension displays in the worksheet name tab.
- Unintended behavior occurs with ERASE command in local macro. (186574)
- Unintended behavior occurs with an empty constant in local macro. (187178, 186574)
Problem Resolved in Minitab Dashboards
- Adding a value for a reference line strips values beyond three decimals. (302982)
Release Date: 10 September 2025
New Features in Minitab Solution Center
SharePoint Integration
From the Minitab Solution Center home page, you can sign in to Microsoft SharePoint® to open files stored on SharePoint sites.
Edit Data from Preview Dialog
Minitab Solution Center displays a preview dialog for data that you can load in Minitab Statistical Software or Minitab Dashboards. When you open a CSV or an Excel file that contains a single sheet, you can perform basic cleaning options directly in the preview dialog or choose to open the data in the Minitab Data Center for more advanced data cleanup.
New Features in Minitab Statistical Software
Response Optimization
After you create a predictive model for a single response using TreeNet®, Random Forests®, or MARS®, you can now choose Response Optimizer from the toolbar positioned at the top of the model results. You can also create an interactive Optimization Plot to determine the optimal settings for predictor variables that will lead to a desired outcome or response value.
Interactive Variability Chart
An interactive Variability Chart is now included in the Graph Builder to visualize sources of variation and identify patterns between factors and a response.
Edit Graph Label Precision
You can now edit the decimal precision of axis and data labels in the options pane for graphs in Graph Builder. In addition to better default identification of decimal precision, you can manually override and set the desired precision.
Type 1 Gage Study – VDA5 Support
Type 1 Gage Study now provides support for uncertainty calculations outlined in the VDA 5 standards.
Stability Study for Mixed Models
The Stability Study dialog now features a Batch input box on the main dialog so users can more easily specify a mixed model.
Problem Resolved in Minitab Statistical Software
Screening DOE dialog limited available terms. (300567)
New Features in Minitab Data Center
Data Center File (.MDCX)
The Minitab Data Center now offers a new file type which allows you to save not only the configured steps, but also the connection information to the source file.
Additional Column Types for Numeric Columns
You have the option to categorize numeric column into five different types:
- Automatic (Numeric)
- Integer
- Decimal number
- Currency
- Percentage
In addition, you can retain the full precision values after formatting for all types except for automatic.
Drag/Drop in the Reorder Columns Dialog
You can now reorder columns via drag and drop in the Reorder Columns dialog.
String Starting and Ending Filters for Text Columns
You can subset values that either start with or end with a specific character/string.
New Features in Minitab Dashboards
Table Asset
You can add a table of the source data as an asset on a dashboard alongside other analytics and visualizations. After you insert a table, you can perform the following:
- Select specific columns to display
- Add a row counter as the initial column
- Wrap text columns
- Sort in ascending or descending order by a specific column
- Manually resize column widths
Release Date: 16 July 2025
New Features in Minitab Solution Center
You can now quickly access files that were recently opened or marked as favorites. In the repository section of the landing page, access the files you need quickly and efficiently by viewing recently accessed files or by marking files as favorites. Both sections display recent and favorite files across your repositories (Microsoft OneDrive® and Google Drive™).
New Features in Minitab Web App
Variability Chart Enhancements
For Variability Chart in Quality Tools, you can now enter one or more categorical By variables to create a separate Variability Chart for each category level for comparison. You can also request a log-10 transformation to the Y-scale of the Means chart when you graph the variability of response data across different factors that are highly skewed or affected by severe outliers.
Transportation Add-on Module
The Transportation Module helps transportation professionals quickly get started with data analysis to do everything from reducing transit time to analyzing key performance indicators related to operational efficiency, asset utilization, safety, environmental performance, financial performance and customer service.
Retal Add-on Module
The Retail Module helps retail professionals quickly get started with data analysis to do everything from increasing sales to analyzing key performance indicators related to customer experience, inventory management, operational efficiency, financial performance, store operations and sales.
Problems Resolved in Minitab Web App
Subset Worksheet does not work as intended when the data set includes a large number of date/time values. (TT187158)
Unintended behavior occurs with certain date/time formats. (292654)
New Features in Minitab Data Center
Reorder Columns
Quickly organize the order of one or more data columns within the Data Grid. The reordering of columns allows you to arrange columns according to your needs and preferences.
Data Summary Panel Visualizations
The Data Summary Panel now provides larger interactive data visualizations that summarize each column of data. Using histograms, you can easily exclude numeric values that are greater than/less than target values or exclude date values that are before/after target dates. Using bar charts, you can directly filter or replace specific data values.
Calculated Column
Create new columns of data based on custom equations using hundreds of predefined mathematical functions.
New Features in Minitab Workspace Web App
Add linked files to your project
You can now quickly access external files directly from Workspace projects by adding linked files. Add links to a variety of files, including documents, presentations, spreadsheets, images, and any file created in the Minitab Solution Center.
Adjust column widths in forms tables
You can quickly and easily adjust column widths of tables on forms to make room for longer text values as needed.
New Features in Minitab Dashboards
Copy & Remap Assets
In Edit mode, you can copy and paste dashboard assets and remap existing assets to a different data source.
Release Date: 18 June 2025
New Feature in Minitab Data Center
Use the Quick Prep menu to prepare data more quickly. This menu provides convenient access to common filtering options for individual values based on column type.
Problem Resolved in Minitab Data Center
The following issue was resolved in Minitab Solution Center June 2025.
- The "Extract at Index" label extends to two separate lines in German. (287738)
Problem Resolved in Minitab Dashboards
The following issue was resolved in Minitab Solution Center June 2025.
- The related dashboard asset is cleared out and needs to be rebuilt when you rename a column in Data Center. (287698)
Release Date: 21 May 2025
New Features in Minitab Web App
Wafer Plot
Wafer plot is a new visualization tool added to Graph Builder that provides the ability to pinpoint the locations of defective integrated circuits or chips across the wafer. Wafer plot is a specialized heatmap used in semiconductor manufacturing to identify potential root causes of manufacturing issues and facilitates the application of statistical process control methods to monitor and improve manufacturing processes.
Boxplot Y-scale Log Transformation
The Graph Builder now includes the option to apply a log transformation to the Y-scale on a Boxplot so you can visualize the distribution of continuous data that is highly skewed or affected by severe outliers.
Quick Designs
Quick Designs is a simple, guided dialog in the DOE menu to help get you started in choosing a design that is right for your problem. It encompasses most used design settings for: Definitive Screening, Factorial, General Full Factorial, Response Surface, Mixtures, and Taguchi designs.
Command Line and History
The Command Line and History pane is now integrated into the Minitab Statistical Software web application. You can use this tool to quickly repeat an analysis on a new set of data or construct a macro to automate a series of analyses.
Problems Resolved in Minitab Web App
- Unintended behavior occurs in graphical summaries and small data. (187463)
- The deletion of report annotation does not work as expected. (187497)
- Incorrect error handling occurs in Attribute Agreement Analysis with numbers as column names. (187263)
- ANOVA model controls do not handle certain characters. (183904)
New Features in Minitab Data Center
Split a text column
You can split columns that contain values separated by a delimiter into new columns. For example, you can split a column where each cell contains three values separated by a comma into three new columns.
Extract text values from a column
You can extract a specific number of characters or use an index to create a new column or overwrite the current column.
Standardize column lengths
You can specify whether to standardize the number of rows across all columns or allow unequal column lengths for a data set.
Refresh data from source
When the original source data file has updates, you can pull in the latest changes to your file in the Data Center.
New Features in Minitab Workspace Web App
Two new templates
Two new templates are available with this release of Workspace in the Minitab Solution Center. Now, you can identify and catalog the sources of variation in a system with the P-Diagram and stay organized with the Checklist.
Improved printing
You can print entire maps and brainstorming tools by selecting Print on the application view bar or by right-clicking the tool in the Navigator and choosing Print. From your browser’s print view, you can print the tool or export it to PDF by using Print to PDF or
Save as PDF. You can also adjust print settings such as layout, scale, and quality.
New Features in Minitab Dashboards
Pan/Zoom
Instead of using browser zoom, you can adjust the zoom level of the canvas area with a native zoom control. You can also pan vertically and horizontally without relying on the canvas scrollbars.
Allow interactions and paging in Edit Mode
You can fully interact with graph elements in both Present and Edit mode. You can view graph tooltips, zoom and pan on graph data regions, use the graph scale navigator/slider for time series and control charts, interact with graph legend items, and more.
In addition to using the Navigator to switch pages in Edit mode, you can also select different pages of the dashboard using the same page control displayed in Present mode.
Multi-select assets and slicers
In Edit mode, you can multi-select assets and slicers to drag, move, or delete them.
Simplified edit behavior
The Asset menu has improved functionality. In Edit mode, you can right-click to access the Asset menu.
Slicer interactivity
You can interact with slicers in Edit mode. The changes apply to all active assets.
Problems Resolved in Online Repositories
- You are not notified when Autosave fails due to lack of space in Cloud Storage Account (Microsoft OneDrive® and Google Drive™).
- Only the first 200 files are displayed in OneDrive.
- When you share a Minitab proprietary file through email, OneDrive unsuccessfully attempts to show the user a preview of the file and selecting the Open button does not successfully open the file.