Document
Real-Time Virtual Process Monitoring ›

Our Statistical Process Control Solutions
Take your process monitoring to the next level with Minitab’s next generation statistical process control solutions. Get insights that will help your team keep accomplishing their goals!

With Minitab solutions, you can build and leverage simple control charts or utilize real-time data to get real-time insights from our next generation of SPC solutions.
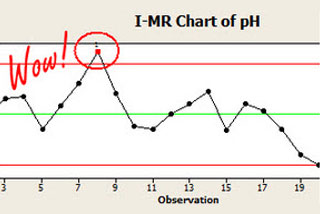
The Value of Control Charts
Control charts tell you whether your process is in-control. If a process is out-of-control, then you need to fix special causes that affect the process intermittently. Once you fix those special causes, the process should be in-control and behave predictably. It’s only after a process is in-control that you can begin making changes to the overall process and know that the changes you see are because of the changes that you’re making, not because of the wild unpredictability inherent in the process. If you need to know whether you need to fix a process or whether you can improve a process, then you need a control chart.
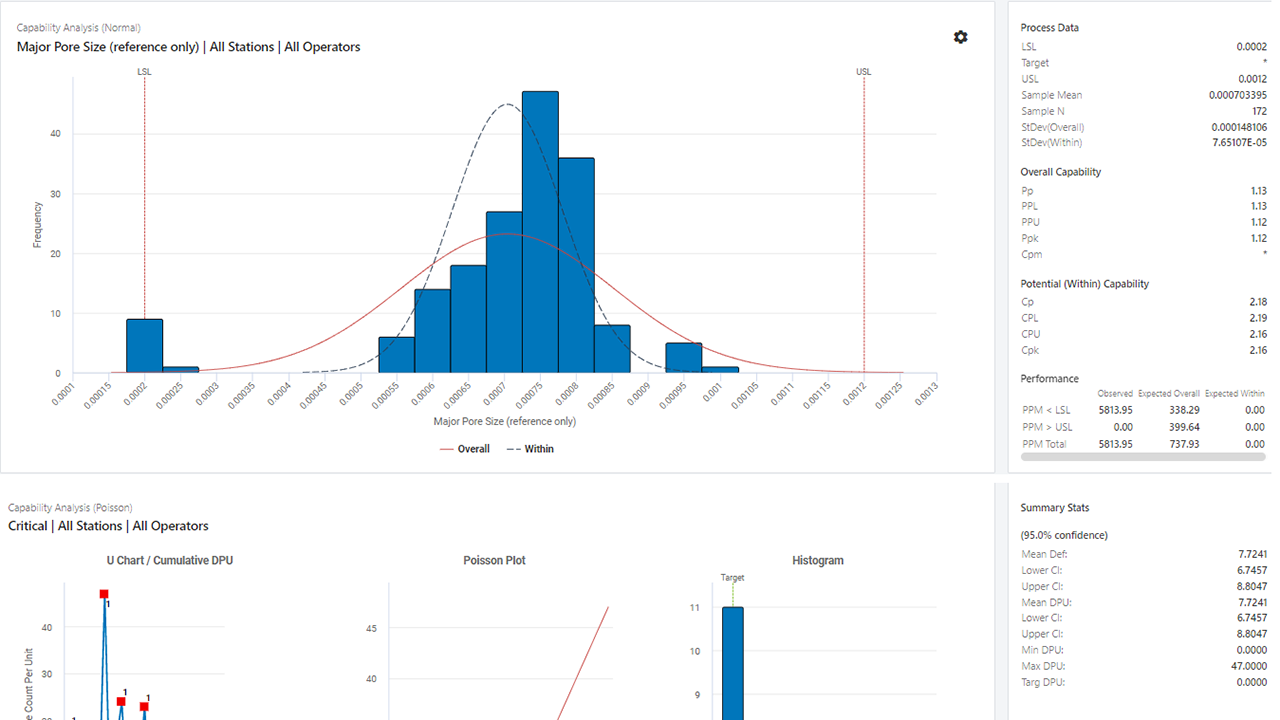
Capability Analysis
How capable is my process? How well am I meeting specifications? These are the two questions we ask ourselves any time we analyze a process to identify areas of improvement. Minitab provides our proprietary Process Capability Sixpack® to accurately assess your process predictability and fit.
Minitab’s free guide will help you master capability analysis, accurately assess your process predictability, and fit, and achieve the perfect Capability Sixpack by exercising four easy steps!
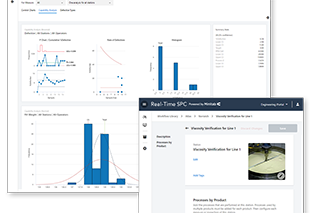
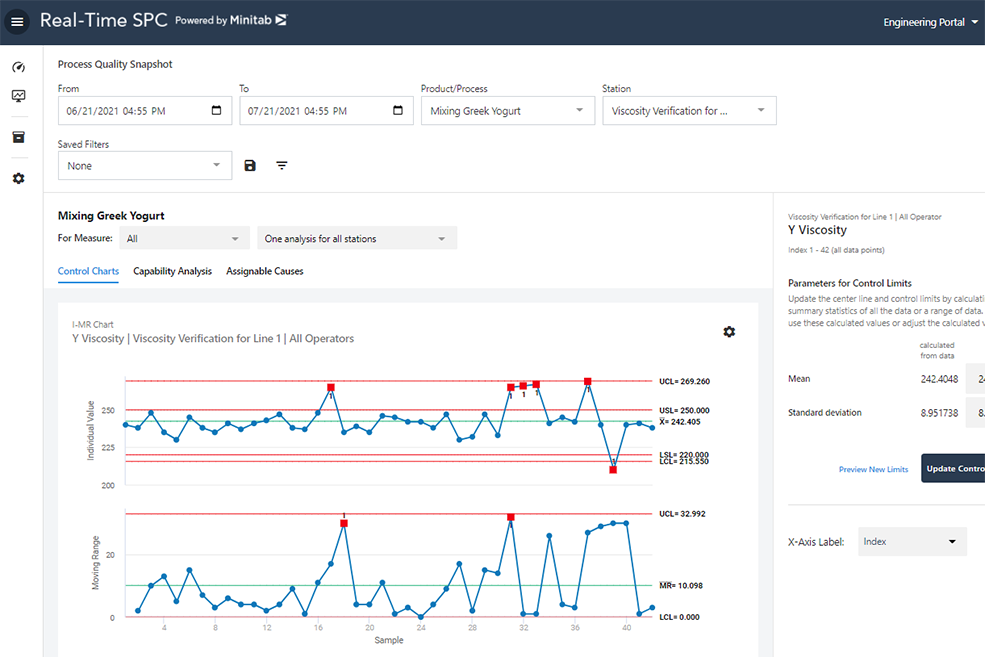
Real-Time SPC
There are various ways practitioners use control charts to help them assess the behavior of their processes, including collecting and analyzing data in real-time. Only Minitab offers practitioners multiple solutions for statistical process control to not only meet their specific needs, but also help them maximize quality and savings.

Real-Time SPC is one of the many solutions Minitab provides you for optimal statistical process control.
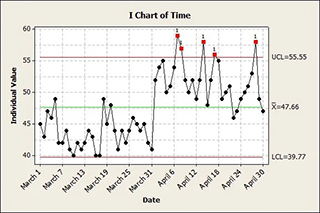
Detect Small Shifts
Control charts are specialized time series plots that help you determine if a process is in statistical control. Although some of the most widely used ones, like Xbar-R and Individuals charts, are great at detecting relatively large shifts in the process (1.5+ sigma shifts), you will need something different for smaller shifts. Minitab’s solutions also leverage analytics, like the powerful Exponentially Weighted Moving Average (EWMA) chart, to detect small shifts in the process mean. This is important because early detection helps you react faster and fix the process.

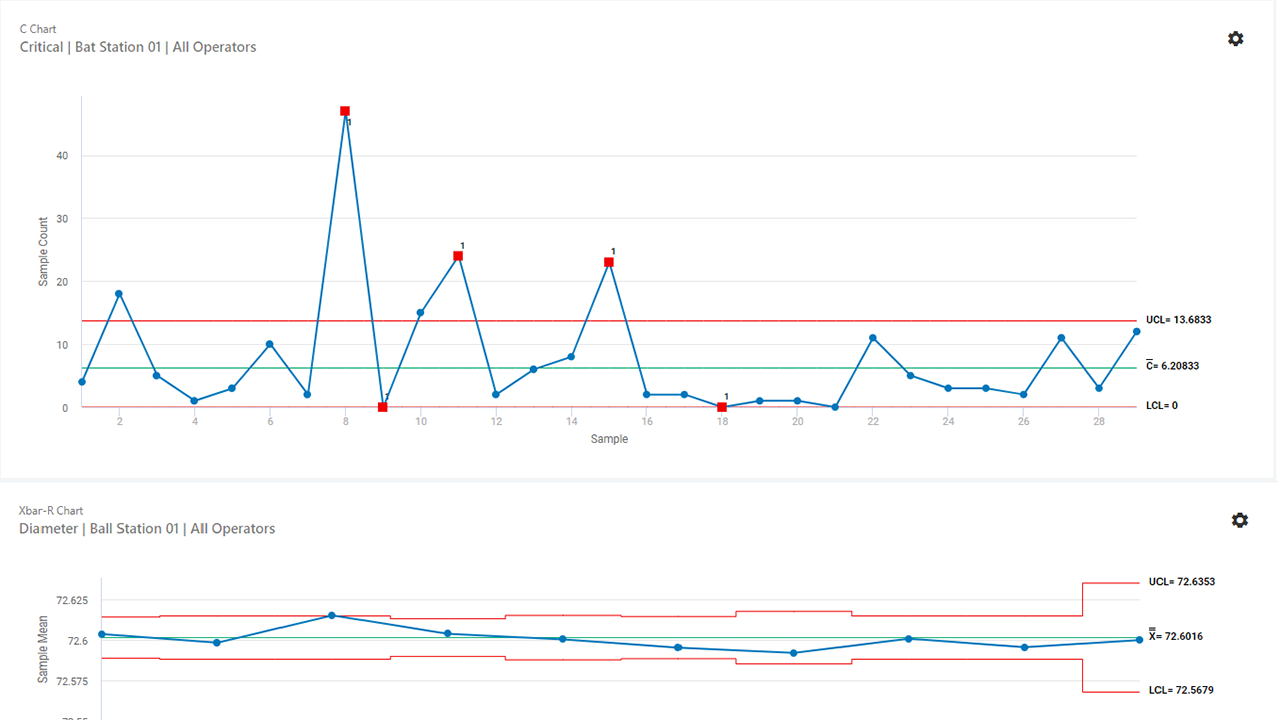
Eliminate False Alarms
When you have too much variation, or “overdispersion,” in your process data, false alarms can result—especially with data collected in large subgroups. The larger the subgroups, the narrower the control limits on a traditional P or U chart. But those artificially tight control limits can make points on a traditional P chart appear out of control, even if they aren't. If your data is affected by overdispersion or underdispersion, using Minitab you can reliably distinguish common-cause from special-cause variation.

Next Generation of SPC Solutions
Is your business missing shipment deadlines due to quality issues? Are you worried about scrap or rework? If you answered “yes” to either question, it’s time to rethink how you’re managing quality.
Only Minitab offers the next generation of statistical process control solutions. Known for our best-in-class traditional SPC, we offer advanced dashboards and Real-Time SPC Powered by Minitab®, which use statistical methods to monitor, alert, and control your process. When manufacturers utilize our solutions, they can identify quality issues before they become problems, ensuring that processes operate efficiently and produce products with little or no waste!
Minitab provides visual process monitoring, immediate alerts, and improvement analytics so businesses know what parts of their process are failing, and that means your business can quickly address and fix any issues without delay. These tools help empower operators, engineers, and management with the information they need to keep work moving forward.
OUR CUSTOMERS
Sr. Materials Engineer
- Micky J.
CEO
OUR CUSTOMERS
Jose Luis P.
Quality Chief
You are now leaving minitab.com.
Click Continue to proceed to: