Our most popular offering for manufacturing, this track provides the foundation for effectively analyzing and improving products and processes. Participants will gain exposure to a broad range of graphical and statistical tools to assess if results are on target, explore relationships between variables, and minimize defects, using examples with metrics such as diameter, pressure, and hardness. Analytical and statistical principles will be presented through real-world examples and exercises.
This course is appropriate for members of a quality team, those leading and facilitating process improvement activities, such as Lean Six Sigma, and practitioners preparing to adopt process improvement in their manufacturing organization.
- Minitab Essentials
- Statistical Quality Analysis
- Factorial Designs (DOE)
- Workshop
DAYS 1-2
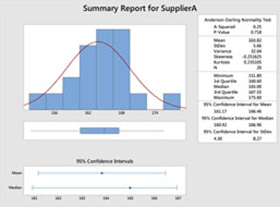
In this 2-day foundational course you will learn to minimize the time required for data analysis by using Minitab to import data, develop sound statistical approaches to exploring data, create and interpret compelling graphs, and export results. Analyze a variety of real world data sets to learn how to align your applications with the right statistical tool, and interpret statistical output to reveal problems with a process or evidence of an improvement. Learn the fundamentals of important statistical concepts, such as hypothesis testing and confidence intervals, and how to uncover and describe relationships between variables with statistical modeling tools.
This course places a strong emphasis on making sound decisions based upon the practical application of statistical techniques commonly found in manufacturing, engineering, and research and development endeavors.
Topics Include:
- Importing and Formatting Data
- Bar Charts
- Histograms
- Boxplots
- Pareto Charts
- Scatterplots
- Tables and Chi-Square Analysis
- Measures of Location and Variation
- t-Tests
- Proportion Tests
- Tests for Equal Variance
- Power and Sample Size
- Correlation
- Simple Linear and Multiple Regression
- One-Way ANOVA
- Multi-Variable ANOVA

DAY 3
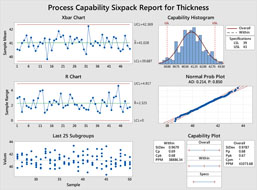
Develop the necessary skills to successfully evaluate and certify manufacturing and engineering measurement systems. Learn the basic fundamentals of statistical process control and how these important quality tools can provide the necessary evidence to improve and control manufacturing processes. Develop the skills to know when and where to use the various types of control charts available in Minitab for your own processes.
Learn how to utilize important capability analysis tools to evaluate your processes relative to internal and customer specifications. The course emphasis is placed on teaching quality tools as they relate to manufacturing processes.
Topics Include:
- Gage R&R
- Destructive Testing
- Gage Linearity and Bias
- Attribute Agreement
- Variables and Attribute Control Charts
- Capability Analysis for Normal, Nonnormal, and Attribute Data
DAY 4
Learn to generate a variety of full and fractional factorial designs using Minitab’s intuitive DOE interface. Real-world applications demonstrate how the concepts of randomization, replication, and blocking form the basis for sound experimentation practices. Develop the skills necessary to correctly analyze the resulting data to effectively and efficiently reach experimental objectives.
Use Minitab’s customizable and powerful graphical displays to interpret and communicate experimental results to improve products and processes, find critical factors that impact important response variables, reduce process variation, and expedite research and development projects.
Topics Include:
- Design of Factorial Experiments
- Normal Effects Plot and Pareto of Effects
- Power and Sample Size
- Main Effect, Interaction, and Cube Plots
- Center Points
- Overlaid Contour Plots
- Multiple Response Optimization

DAY 5 - Optional
Minitab training provides the foundation for improving your efficiency to use statistics to analyze data. The examples present real-world scenarios to learn the tools, while the exercises allow time to practice. Bring your educational journey full circle by reinforcing the training using data from your company. This affords the attendees the opportunity to relate directly to their own use cases.
The workshop places strong emphasis on making sound decisions based upon the practical application of statistical tools to your company projects with your data.
Topics will be determined by the specific customer data brought to the workshop.