As our most popular service offering, this track provides the foundation for effectively analyzing data in financial and related industries. Participants will learn to apply a broad range of data analysis, including graphical and statistical techniques to assess if processes are on target, relationships between variables, and how to minimize defects using examples with metrics such as time, ratings, and revenue. Analytical and statistical principles will be presented through real-world examples and exercises.
This course is appropriate for individuals at any services organization who wish to leverage the power of predictive analytics to solve problems. The course is popular among business analysts, members of a problem-solving team, those leading and facilitating process improvement activities (such as Lean Six Sigma or operational excellence), marketing analysts, and practitioners preparing to adopt process improvement in their service organization.
- Minitab Essentials for Service Quality
- Statistical Modeling for Service Quality
- Statistical Quality Analysis for Service Quality
- Workshop
DAY 1-2
In this 2-day foundational course you will learn to minimize the time required for data analysis by using Minitab to import data, develop sound statistical approaches to exploring data, create and interpret compelling graphs, and export results. Analyze a variety of real world data sets to learn how to align your applications with the right statistical tool, and interpret statistical output to reveal problems with a process or evidence of an improvement. Learn the fundamentals of important statistical concepts, such as hypothesis testing and confidence intervals, and how to uncover and describe relationships between variables with statistical modeling tools.
This course places a strong emphasis on making sound decisions based upon the practical application of statistical techniques commonly used in business, transactional, and services processes.
Topics Include:
- Importing and Formatting Data
- Bar Charts
- Histograms
- Boxplots
- Pareto Charts
- Scatterplots
- Tables and Chi-Square Analysis
- Measures of Location and Variation
- t-Tests
- Proportion Tests
- Tests for Equal Variance
- Power and Sample Size
- Correlation
- Simple Linear and Multiple Regression
- One-Way ANOVA
Prerequisites: None


DAY 3
Expand your set of available statistical tools by analyzing data from real world problems experienced in service industries. Strengthen analysis skills with tools used to explore and describe relationships between variables. Learn to discover and describe features in data related to the effect and impact of time, and how to forecast future process behavior.
Utilize graphical and quantitative approaches to describe similarities and differences between the effects of various factors on important quality characteristics. Learn how to find and quantify the effect that factors have on the probability of a critical event occurring.
Topics Include:
- Multi-Variable ANOVA
- Binary Logistic Regression
- Factorial Designs
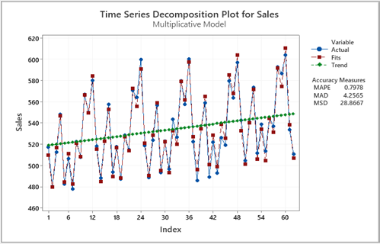
- Time Series Tools, including Forecasting
- Seasonality and Decomposition
- Multiple Linear Regression including Best Subsets and Stepwise Regression
Prerequisites: Minitab Essentials for Service Quality

DAY 4
Develop the necessary skills to successfully evaluate and certify your measurement systems. Learn the basic fundamentals of statistical process control and how these important quality tools can provide the necessary evidence to improve and control your processes. Develop the skills to know when and where to use the various types of control charts available in Minitab. Learn how to utilize important capability analysis tools to evaluate your processes relative to internal and customer specifications.
The course emphasizes the teaching of quality tools as they pertain to service industries.
Topics Include:
- Attribute Agreement for Binary, Nominal, and Ordinal Data
- Kappa and Kendall’s Coefficients
- Gage R&R
- Variables and Attribute Control Charts
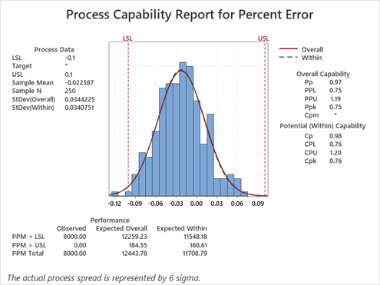
- Capability Analysis for Normal, Nonnormal, and Attribute Data
Prerequisites: Minitab Essentials for Service Quality

DAY 5 - Optional
Minitab training provides the foundation for improving your efficiency to use statistics to analyze data. The examples present real-world scenarios to learn the tools, while the exercises allow time to practice. Bring your educational journey full circle by reinforcing the training using data from your company. This affords the attendees the opportunity to relate directly to their own use cases.
The workshop places strong emphasis on making sound decisions based upon the practical application of statistical tools to your company projects with your data.
Topics will be determined by the specific customer data brought to the workshop.