




Bobcat
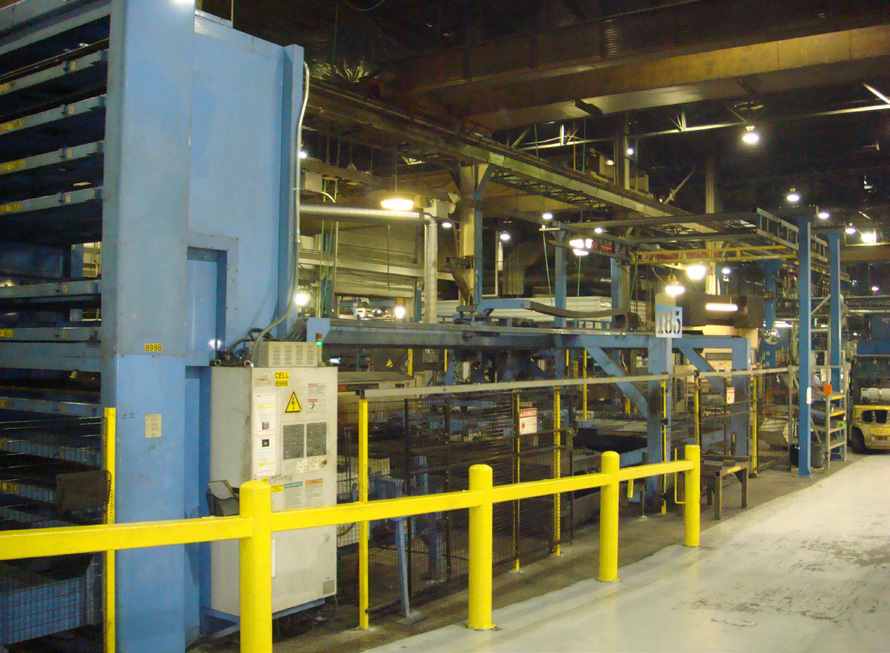


For more than 50 years, Bobcat Company has been a world leader in the design, manufacture and distribution of compact equipment, including skid-steer loaders and, compact excavators. Bobcat’s equipment is used in many industries including agriculture, construction, excavating, and landscaping, and equipment rental. In addition to having the most extensive compact equipment distribution network in the world, the company is North Dakota’s largest manufacturer. At one of its plants, Bobcat uses lasers to cut detail parts out of large sheets of steel. These parts need to have smooth edges, with no burrs or pits. The laser-machining process was producing acceptable quality at an acceptable rate, but had room for improvement, and even though the facility had seven lasers, it still needed to send laser work to outside contractors. Jim Rose, a certified Master Black Belt at Bobcat, set out to improve this laser-cutting process. His goal was to determine settings that would increase the speed of the machines while improving the quality of the parts. The project depended heavily on gathering data efficiently, analyzing it thoroughly, and understanding the results. Rose used Minitab Statistical Software to accomplish these tasks.
The Challenge
Rose set out to find a "sweet spot" that would give both faster laser processing and better cut quality. The stakes were high. Improving production speeds an average of 15% would be the equivalent of "saving" an additional laser, each of which cost nearly $1 million to install. Increasing output from the seven existing lasers also would decrease the amount of outsourced "beam hours"—and with the plant outsourcing a healthy portion of their laser work, bringing even some of that work back in-house would yield substantial savings.
Bobcat’s laser-cutting process used a fast cutting speed for long, straight cuts, and a slow cutting speed for short cuts and angles. Finding settings that would let the plant boost either or both of these cutting speeds while improving cut quality could greatly increase the plant’s capacity, bring back work that was farmed out, and reduce costs.
In studying the process, Rose identified several factors that could affect its performance. These included power (in watts), the percentage of cut time the laser beam was actually on (duty), the feed rate for the fast cutting speed, the feed rate for the slow cutting speed, the amount of gas used in the laser torch (assist gas pressure), the width of the nozzle controlling the beam, and the focus distance from the nozzle to the cutting surface. Now his challenge was to identify which of these factors had the biggest impact on performance, and then find process settings that would increase both speed and product quality.
How Minitab Helped
That’s where Minitab Statistical Software’s Design of Experiments (DOE) capabilities come in. A designed experiment is a series of runs, or tests, in which you adjust multiple variables. It’s an efficient way to improve a process because you can change and evaluate more than one factor at a time, then use statistical analysis to get meaningful results. Minitab can help you determine which factors are most important, and understand how they interact and drive your process. Armed with that knowledge, you can find the factor settings that produce optimal process performance.
Rose’s first task was to select and quantify the right response. Improving, or at least maintaining, the quality of the parts produced at a faster rate was a primary goal, so he selected cut quality as the critical response. One experimental "run" would consist of cutting one sheet of steel. Cut quality would be ranked on a 1-5 scale, with 5 being a perfect cut. To establish a baseline, Rose did a preliminary analysis of parts cut with the existing settings, which showed the process was producing cuts with an average score of 4.
A laser operator who was enthusiastic about helping to find faster settings volunteered to evaluate parts produced in each run. Like any researcher, Rose needed to make sure he could rely on the precision of the measurement system before the experiment could begin. He used Minitab to perform an attribute agreement analysis, which would demonstrate whether the operator could assess cut quality consistently and accurately, according to the established standards. Based on the results of the analysis, one laser operator was selected as the sole evaluator. He was even able to use a more precise scoring system that incorporated ¼ increments (.25) instead of the whole numbers used previously. This improved the power of the data collection.
With the factors, critical response, and a reliable data collection method in place, Rose was ready to design his experiment. He knew factorial experiment design would let him study the effects of multiple factors on the process, but he needed to find the type of factorial design that would yield reliable results with the fewest experimental runs. He used Minitab to explore his options and identify the best one.
One option was a full factorial experiment, a very thorough approach that measures responses at all combinations of the factor levels. But this option can require a prohibitive number of runs. For example, a two-level full factorial design with 5 factors requires 32 runs. Considering that an experimenter may want to then add replicates , or repeat the runs multiple times, in many cases a full factorial experiment isn’t a viable option.
Rose instead looked at fractional factorial designs, which reduce the number of runs to a manageable size by excluding some combinations of factor levels, but still yield a reliable analysis of the factors. The runs that are performed are a selected subset, or fraction, of the full factorial design. But not running all factor level combinations means that some effects are confounded, and cannot be estimated separately from other effects. Therefore, the fraction must be carefully chosen to achieve meaningful results. To make the process easier, Minitab displays an alias table which specifies the confounding patterns.
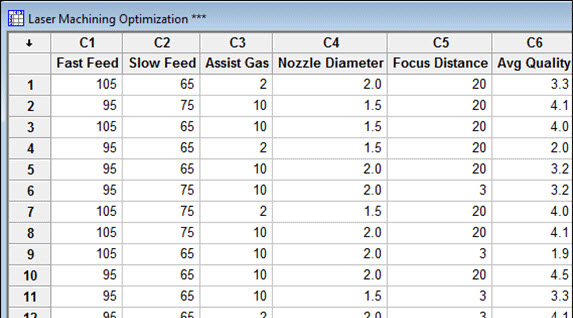
For his initial experiment, Rose used Minitab to create a ½ fraction factorial design that required just 16 runs (Figure 1), but still permitted him to estimate the effects of both the factors and their two-way interactions. Rose also replicated the 16 runs 3 times to improve the power of the data collection, thus increasing the likelihood the experiment would identify a significant difference.
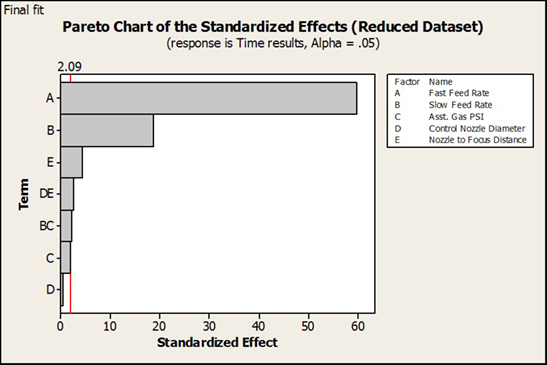
That first experiment found that the fast speed feed rate and then slow speed feed rate were the most important determinants of process speed, and more importantly, demonstrated that faster feed rates were feasible. (Figure 2).
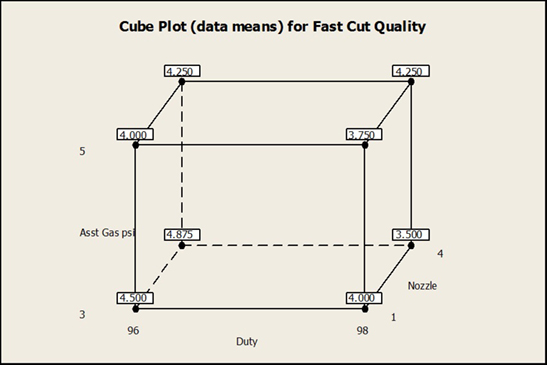
Rose’s follow-up experimentation focused on the finding the best settings for the remaining three significant factors to improve cut quality at the higher speed. A cube plot of results (Figure 3) showed the highest cut surface quality at the low assist gas pressure and duty and a high level of nozzle focus when the speed had been increased. It also indicated that the expected cut quality was higher than the standard of 4.0 at the old settings.
Results
The three designed experiments Rose used to evaluate the laser-cutting process yielded great results. The experiments established an improved definition of machined edge quality and identified optimized settings that improved process production rates by more than 20% across all products. Increasing output from the 7 existing lasers eliminated the need to purchase additional laser machinery, saving over $500,000. The increase also eliminated some 2,000 hours of "beam time" that would have been outsourced. In all, the results of the experiments that Rose designed and analyzed with Minitab Statistical Software had a total potential impact of more than $1,000,000.