




Tate & Lyle



Tate & Lyle is a global leader in the food and beverage industry, validated by a long and impressive track record of "making food extraordinary" by turning corn, tapioca and other raw materials into ingredients that add taste, texture and nutrients to foods. One of their most recognizable products in the US is the sweetener SPLENDA® Sucralose.
When they faced a challenge in the process of refining corn sugars, Tate & Lyle turned to Minitab software for assistance.
The Challenge: Evening Out Crystallization Particle Size
When Adam Russell started working as Global Operations Master Black Belt at Tate & Lyle, he was given a challenge: Keep the particle size of their corn sugars the same.
"One of the critical to quality features of one crystallization process is particle size distribution," Russell said. "Why on earth does this matter? Well, when we developed these products for consumers 20-30 years ago they wanted corn sugars to have the same taste and texture as regular table sugar or cane sugar. You have to hit within a certain particle size distribution for that situation be true."
Tate & Lyle was facing a struggle with those particles falling outside of the acceptable range, and they could not identify the reason. The company had a list of traditionally held factors they had determined impacted the particle size variation:
- Temperatures
- Pressures
- Flow rates
- pH
- Conductivity
And the list goes on.

How Minitab Helped
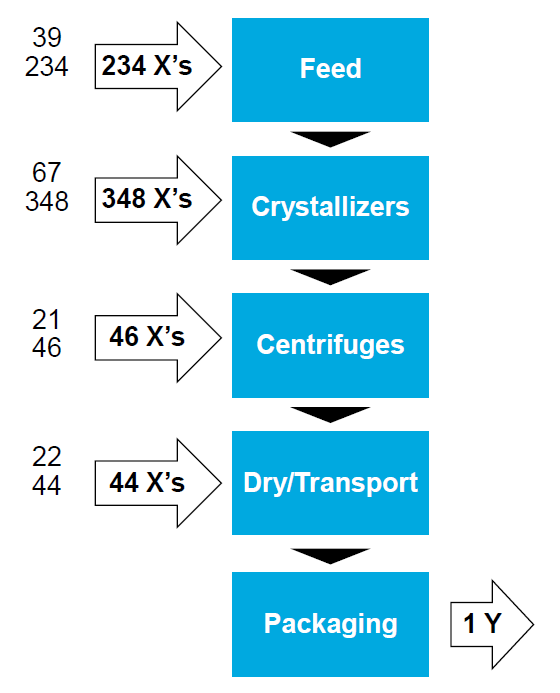
They started by using Companion by Minitab (now Minitab Engage®) to create a process map which showed the high-level view of the crystallization process (learn more about process maps). They were not reliably hitting a tight particle size distribution, so they wanted to understand what was causing variation and how to control it.
"Everything is measured in a chemical plant,” Russell said. “Every point possible has a transmitter that's providing information back to a data historian. That's a great thing, but it creates the challenge of we have so much information I don't know what to do with it."
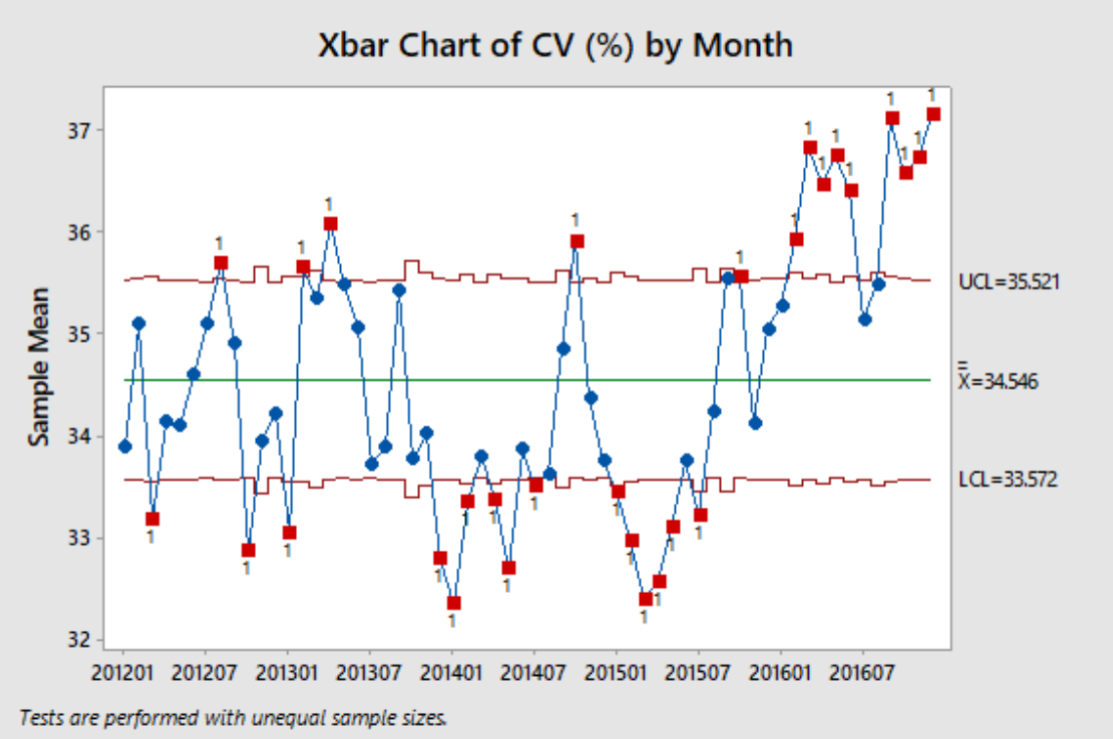
To visually understand the particle size data, Russell and his team then used Minitab Statistical Software to create the Xbar chart shown below.
Many of the relationships between the variables were non-linear though, so it proved difficult to identify the impact any one had on another. Also, the particle size is unknown until it’s placed in the bag for consumers because it is in a drying stage in a gel-like form between liquid and solid, known as "slurry."
There are more than 1,000 possible inputs to a model like this. Multiple regression models alone could not lead to the answers.
With numerous predictors interacting with each other in infinite complex ways, they needed an organized approach to identify which predictors impacted the particle size distribution the most. They needed TreeNet in Salford Predictive Modeler (SPM).
"Just using traditional modeling techniques, it was hard," Russell said. "It was very difficult for us to understand the relationships between the variables and the outcomes. Fortunately, SPM's TreeNet made it very simple for us to hone in on the key predictors and be able to devise strategies to be able to deal with those effectively. I’m a believer that Minitab and SPM's TreeNet algorithm can work very effectively together. SPM is certainly not a replacement for Minitab or other statistical programs, but when we use them together I think we get to answer it sooner rather than later."
Russell used the default settings in TreeNet and adjusted the number of trees. As he started shaving predictors, he began to understand the effect it had against a test R-squared value.
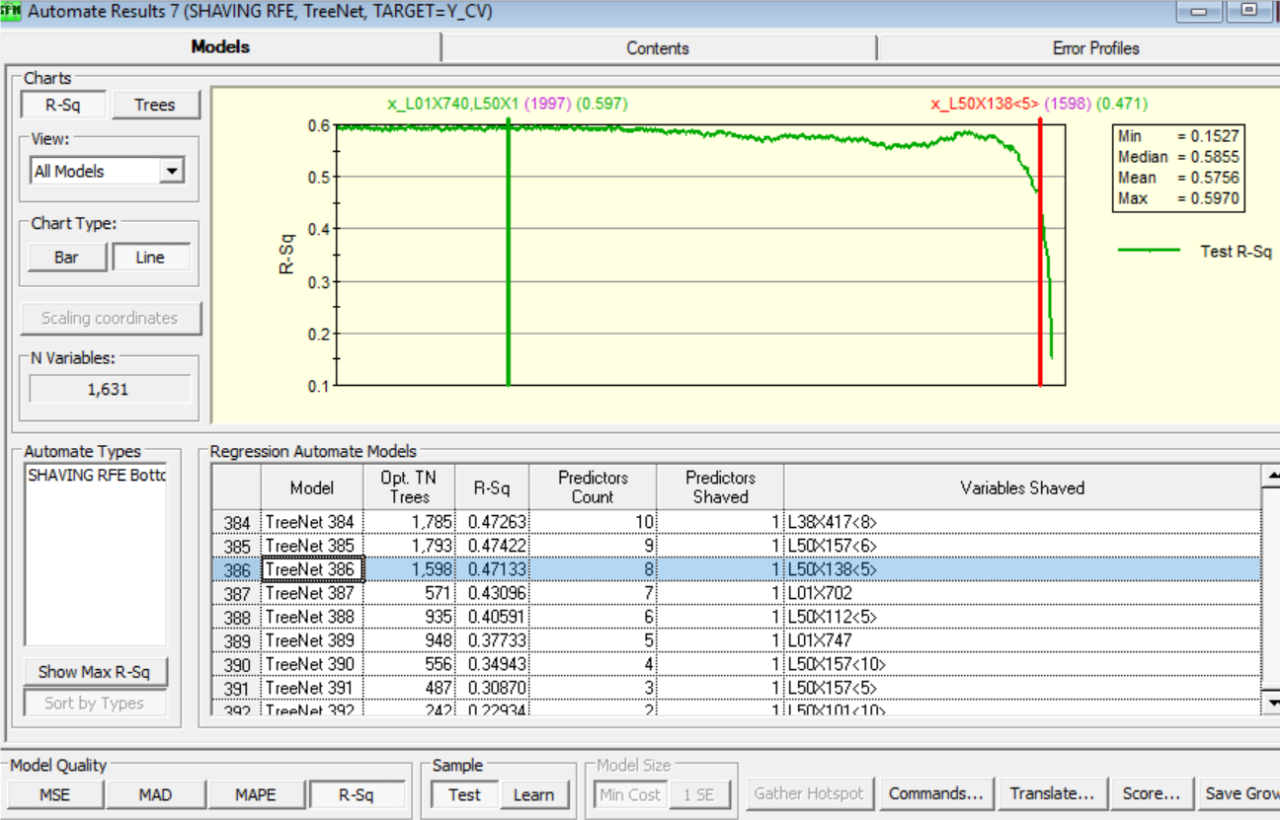
In order to find the true meaning behind these critical variables, Russell used SPM's partial dependency plot. Certain variables were falling on the steep locations on the partial dependency curve, which revealed their importance. Without the SPM partial dependency curve, the importance of these variables would never have been found.
Then he used a straightforward, stepwise approach. He pulled out the variables one at a time and watched to see what happened to R-squared. It did not change significantly until he took out the fourth most important variable. He took this variable to the manufacturing team and asked for more information on it.
The Results
Russell quickly narrowed down over 1,000 predictors to only 8 using SPM's variable importance ranking. And those 8 predictors were responsible for nearly half the variation in the test samples alone.
Using SPM's "shaving from the top" feature, Russell could quickly see that one variable had a significantly greater effect on R-squared than any of the other variables. It turned out that this was the variable associated with the feed stream to the crystallization system but its impact on the final product was not clearly understood until Russell created an SPM model.
Then, with SPM's partial dependency plots, Russell could see why this variable was so important in the unreliability of the particle size. SPM's partial dependency plots showed how this variable would likely change in response to changes in where they were "running on the distribution curve."
"We're running on the steep part of this distribution curve," Russell said. "On lucky days, the coefficient of variation is going to be low, but on unlucky days, the coefficient of variation is going to be high. Without SPM, I'd never know that."
Satisfied his goal had been met, Russell found a few ways they could reduce the variation in the final size of their corn sugar crystals and help food manufacturers use those ingredients to improve their products for the consumers.
*This case study was created using Companion by Minitab, prior to the 2021 Introduction to Minitab Engage.