This track teaches the foundation for predictive analytics. Participants will learn data analysis techniques--including statistics, modeling, and machine learning--to analyze patterns found in historical data. Analyzing this data will help you gain better insights, identify potential risks, seek out improvement opportunities, and make predictions about the future. Analytical principles will be presented through real-world examples and exercises.
This course is appropriate for individuals at any organization who wish to leverage the power of predictive analytics to solve problems. The course is popular among business analysts, members of a problem-solving team, those leading operational excellence activities, marketing analysts, and practitioners preparing to implement predictive analytics in their organization.
- Fundamentals of Analytics
- Regression Modeling and Forecasting
- Machine Learning
- Advanced Machine Learning
- Workshop
DAY 1
In this foundational course, you will learn to minimize the time required for data analysis by using Minitab to import data, develop sound statistical approaches to exploring data, create and interpret compelling visualizations, and export results. Automate your Minitab analysis with minimal user input to save time. Analyze a variety of real-world data sets to learn how to align your applications with the right analytics tool and interpret the statistical output. Learn the fundamentals of important statistical concepts such as hypothesis testing and confidence intervals.
This course places a strong emphasis on making sound decisions based upon the practical application of statistical techniques commonly used in business, manufacturing, and transactional processes.
Topics Include:
- Importing and Formatting Data
- Exec Macros
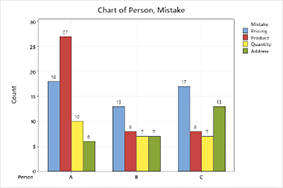
- Bar Charts
- Histograms
- Boxplots
- Pareto Charts
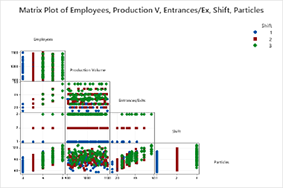
- Scatterplots
- Measures of Location and Variation
- t-Tests
- Test for Equal Variance
- Power and Sample Size
Pre-requisites: None

DAY 2
Continue to build on the fundamental statistical analysis concepts taught in the Fundamentals of Analytics course by learning to explore and describe relationships between variables with statistical modeling tools. Discover and describe features in data related to the effect and impact of time, and how to forecast future behavior.
Learn how to find and quantify the effect that input variables have on the probability of a critical event occurring. Hands-on examples illuminate how modeling tools help reveal key inputs and sources of variation in your data.
Topics Include:
- Scatterplots
- Correlation
- Simple Linear Regression
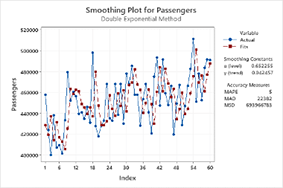
- Time Series Tools, including Exponential Smoothing
- Trend Analysis
- Decomposition
- Multiple and Stepwise Regression
- Binary Logistic Regression
- Regression with Validation
Pre-requisites: Fundamentals of Analytics or Minitab Essentials
DAY 3
Expand your analytics by analyzing data from real world problems experienced in many industries to explore and describe relationships between variables. Learn to use supervised machine learning techniques such as CART® to analyze patterns found in historical data to gain better insights, identify potential risks, seek out improvement opportunities, and make predictions about the future.
Use unsupervised machine learning tools such as Clustering to detect natural partitions in the data and group observations or variables into homogenous sets. Reduce the dimensionality of data by transforming the original data into a set of uncorrelated variables.
Topics Include:
- Discriminant Analysis
- Test Set Validation
- K-fold Validation
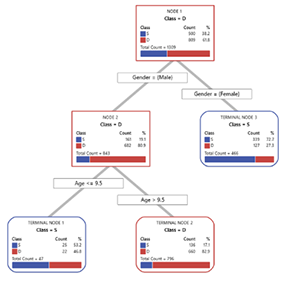
- CART® Classification
- Correlation
- CART® Regression
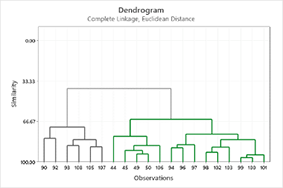
- Cluster Analysis
Pre-requisites: Fundamentals of Analytics and Regression Modeling and Forecasting OR Minitab Essentials
DAY 4
Take your analytics to the next level by analyzing data from real world problems to explore and describe relationships between variables. CART trees provide a simple tree structure for interpreting complex relationships. However, their predictive capability can often be improved by using more powerful model, which create numerous simple models (or trees) and combine them into one final model. Learn to use advanced modeling techniques such as MARS®, TreeNet® and Random Forests® to analyze patterns found in historical data to gain better insights, identify potential risks, seek out improvement opportunities, and make predictions about the future. Note: A subscription to the add-on Predictive Analytics Module is required for this course.
Topics Include:
- Validation
- CART® Classification
- TreeNet® Classification
- Random Forests® Classification
- Correlation
- MARS® Regression
- CART® Regression
- TreeNet® Regression
- Random Forests® Regression
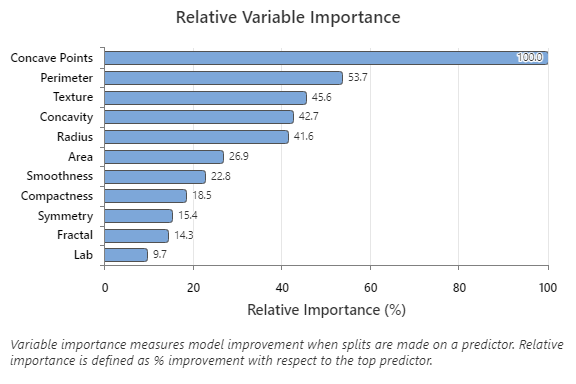
- Discover Key Predictors
- Automated Machine Learning Modeling
Pre-requisites: Fundamentals of Analytics, Regression Modeling and Forecasting, Machine Learning OR Minitab Essentials and Machine Learning

DAY 5 – OPTIONAL
Minitab training provides the foundation for improving your efficiency to use statistics to analyze data. The examples present real-world scenarios to learn the tools, while the exercises allow time to practice. Bring your educational journey full circle by reinforcing the training using data from your company. This affords the attendees the opportunity to relate directly to their own use cases.
The workshop places strong emphasis on making sound decisions based upon the practical application of statistical tools to your company projects with your data.
Topics will be determined by the specific customer data brought to the workshop.