
For over 50 years, USC Consulting Group (USCCG) has been driving operational excellence with a mission to provide real value by improving financial performance. USCCG helps companies reach their highest potential by improving processes and operations across their entire supply chain. Minitab’s solutions play an essential role in helping USCCG solve problems for their customers and remain a key component of enabling their operations to continue running at optimal levels.
The Challenge
If you are in the business of filling packages, you know the importance of controlling fill processes. Overfill has the same net effect as giving away money to your customers. In high volume operations, this can quickly add up to hundreds of thousands of dollars on an annual basis. On the other hand, if you under-fill, the fines and the damage to your reputation can be even more costly.
When filling packages, the first requirement is to meet governmental regulations for compliance with net content declarations on packaged goods. Simply put, your unit fill weights must be above a specified minimum, according to the Maximum Allowable Variance (MAV). Your average fill weight must be at or above, never below, the label declaration.
Many companies today feel that overfilling is the only way to avoid regulatory fines and maintain customer loyalty. Thus, their goal is to get as close as possible to the declared package weight without going under it. This seems perfectly sensible, but many companies have difficulties meeting this goal. Is it because they do not fully understand their process capabilities? Or have they not adopted correct tools and techniques, e.g., Lean, Six Sigma, or technology, to help reduce variation and control processes? Perhaps it is simply a matter of execution. The answer lies in part or all the above.
Minimizing and controlling fill weight variation and performing statistical modeling can redirect a considerable amount of money to your bottom line. Minitab is the solution of choice to optimize fill weight and has helped customers across a variety of industries reduce millions of dollars of overfill.
How Minitab Helped
When USCCG statistically analyzed jellybean fill weights for a leading candy manufacturer, they determined that the actual average fill weights by SKU were as much as 7% above label claim. However, just by looking at averages can be very misleading, as fill weight variation can easily wash out the opportunity to recover any overfill.
When observing the fill process, USCCG also realized that the operators were reacting in response to fill weight measurement feedback and interfering with the processes instead of understanding true sources of variation and making permanent corrective actions. This was a contributing factor to the high process variation relating to fill weight variation. Knowing when to let the process run versus making fill weight adjustment, is paramount. The need for Statistical Process Control (SPC) charting by line and product was evident.
Using Minitab Statistical Software, the overall capability of the process was first examined both by line and SKU, in reference to the declared label weights and the Maximum Allowable Variances (MAV). Results showed the process was prone to overfilling. The manufacturer with USCCG’s guidance was then able to minimize both variation and overfill using an Xbar/R Control Chart.
Figure 1 below shows an example of the overall capability of fill weights for a jellybean package with a label claim of 2268g. The lower specification limit is 2205g based on the MAV. The data was transformed using Johnson transformation to fit a normal distribution.
 = 2268g, Average fill =2294.88 and a LSL=2205g.")
Figure 1: Overall capability of a Jellybean package fill process; Target (label claim) = 2268g, Average fill =2294.88 and a LSL=2205g.
As seen in Figure 1, the average fill weight of 2294.8g is more than 26g above label claim and the expected overall units <LSL is minimal. Additional modelling (Figure 2) suggests a 26g shift to lower fill weights results in an average fill weight of 2268.88g. Also, the Cpm increased from 0.75 to 1.46. Here, too, the model shows minimal units below the LSL. It should be noted that all process lines have check balances with a kick-off mechanism to ensure packages are not shipped below the MAV.
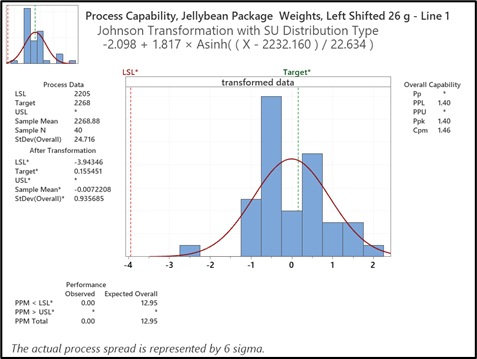
Figure 2: Overall capability model of a Jellybean fill weight shifted 26g to lower fill weights shows minimal unit weights below the LSL and with an average fill weight of 2268.88 g.
Since the average package weight complies with the label claim and the minimal MAV units projected by the model, approximately 13 will be kicked off at in-line check balances and both governmental regulations for label claim will be met. USCCG can now create an Xbar/R Chart (Figure 3) and utilize these control limits as a starting point not only to help maintain the centerline as estimated by the overall capability model, but to further reduce the weight variation. This, in turn, would enable a further reduction or elimination of MAV units.
Many organizations play a balancing act between overfill reduction and rejects due to MAV violations. For example, if the centerline shown in our capability model generated a high number of MAV violations (unacceptable to many fill operations), one may be forced to shift the average (centerline) higher in order to reduce the number of MAV rejects. The tradeoff is more overfill for less rework – the activity of opening rejected packages and introducing the material back into the value stream. The key is to use the Xbar/R Chart to reduce fill weight variation, maintain centerlines and avoid rework as a result of unit rejects.

Figure 3: Xbar/R chart showing the center line and corresponding control limits to be used based on the overall capability model.
Estimated centerlines and control limits should never be considered absolute and will need to be tested in practice. Thus, control charts should be implemented though 4 main steps:
- If not well understood, determine the relationship between the input(s) and the output(s) to ensure the effects of process adjustment are well understood. This enables operators to react effectively when the process is out of control and center the process quickly. This step also helps to qualify the control limits that have been estimated.
- Use the control chart test rules – western electric rules and the relationships established in step one to verify the process can be maintained in control and the fill weight average (centerline) is achieved.
- Train the operators and necessary staff on the benefits and use of control charting prior to deployment. Coaching and mentoring operators at the process lines during charting is recommended. Also, create a daily chart review process to ensure: (1) the charts are utilized correctly, (2) chart center line is achieved, (3) zero or minimal MAV violations occur and (4) special causes are identified and acted upon.
- Review periodically whether variation has decreased and if control limits will need to be recalculated. Continuing overall capability analysis will also help to establish new centerlines.
It must be made clear that although applying methods of capability analysis and statistical process control greatly helps to reduce overfill, it is not the entire solution. To deliver the entire benefit, lean tools, techniques and methods should also be applied to help improve continuous flow of materials, increase equipment uptime and reduce changeover time. The combined effort will result in significant material savings and increased throughput.
Result
The proof is in the numbers. Overfill for packaged candy was reduced by more than 50%, which resulted in more than $1.2 million of annual material savings. How sweet it is!
About Guest Author
Dr. Frank J. Esposto heads the quality practice for USCCG and has been with the company for over 18 years. As Senior Director of Quality and a Lean Six Sigma Master Black Belt, Dr. Esposto is responsible for organizing and leading Lean/Six Sigma engagements for USCCG’s diverse group of clients. He has worked with clients in many industries to resolve productivity/quality issues by customizing and delivering problem-solving solutions and approaches, different types of problem-solving training, or solving specific problems where core competencies were lacking in-house. Dr. Esposto has also delivered Black Belt and Green Belt training across numerous industries, where he has implemented Six Sigma initiatives in combination with Lean.
Access Minitab Case Study
Provide some additional information to view the case study.
The Organization
- Operations management consulting firm with specialty in process improvement
- Headquartered in Tampa, FL
- Employs around 200 people
The Challenge
When filling packages, the first requirement is to meet governmental regulations for compliance with net content declarations on packaged goods. Unit fill weights must be above a specified minimum, while the average fill weight must be at or above, never below, the label declaration.
Products Used
Minitab® Statistical Software
Results
- Overfill for packaged candy was reduced by more than 50%.
- More than $1.2 million of annual material savings.