What M&M’s Can Teach Us About Trusting Data
Almost everyone enjoys M&M’s. Data analysis? That’s another story. For many people, it can feel abstract or intimidating.
But these tiny candies turn out to be a surprisingly effective way to make data practical, visual, and easy to understand.
To get started, we used the appropriate hypothesis test in the Minitab Solution Center, which guides you step-by-step based on your goal and data type. From there, it was simple: weigh a few bags. Count what’s inside. Track colors. Look for misprints. Before long, we were answering real questions with real numbers.
Are the Bag Weights Accurate?
Each small bag of M&M’s is labeled as weighing 49.3 grams.
To see whether that claim holds up, we weighed 30 bags and used a one-sample t-test in Minitab to compare the average weight to 49.3 grams.
Our results showed that the average weight was 52.040 grams, and our P-value was 0.000. Because the p-value is far below 0.05, we can confidently conclude the average bag weight is not 49.3 grams.
In this case, that’s good news. The bags were actually heavier on average — meaning consumers are getting more than what’s printed on the label.
Would Two People Get the Same Measurements?
If two people weigh the exact same 30 bags using the same scale, will their results match?
We tested this using a paired t-test.
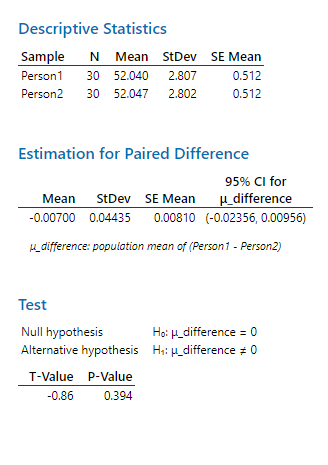
Because the p-value (0.394) is greater than 0.05, there’s no meaningful difference between the two sets of measurements. In other words, the measurements are consistent and repeatable.
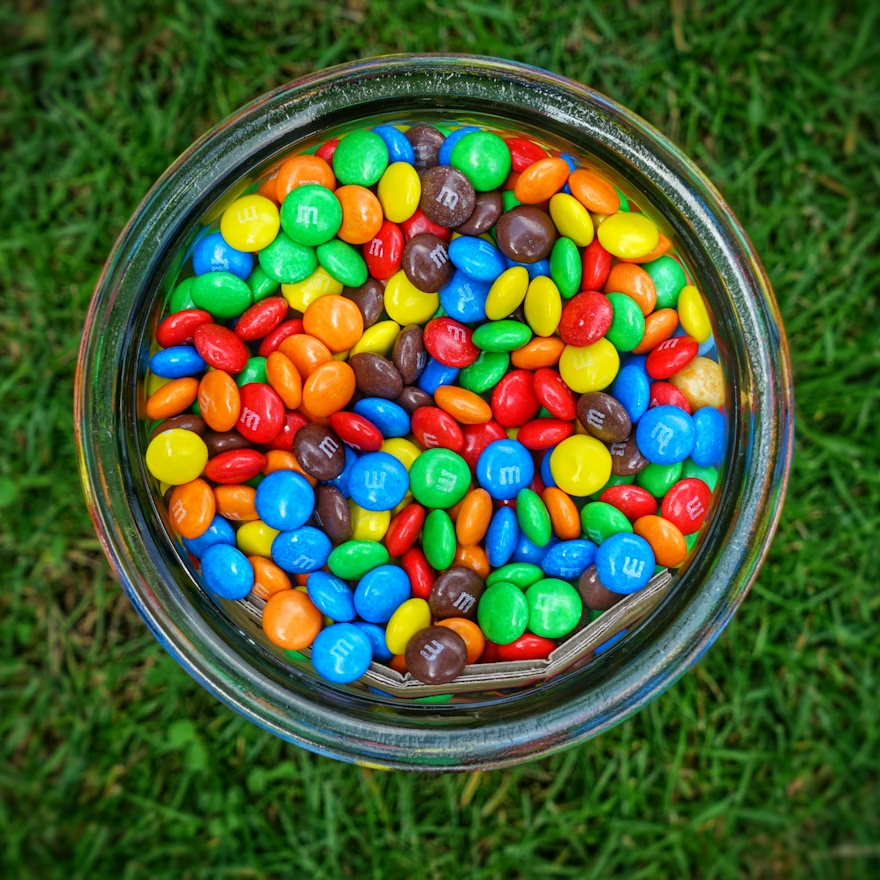
How Many M&M’s Have a Misprinted “m”?
Each M&M is stamped with the familiar “m.” Given the uneven surface of a peanut M&M, it’s not surprising that some are imperfectly printed.
Suppose the requirement is that no more than 15% of candies have a misprinted “m.”
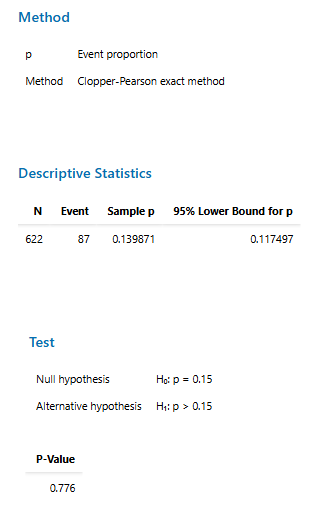
Since the p-value is well above 0.05, we do not have evidence that the misprint rate exceeds 15%. The quality level appears to meet the requirement.
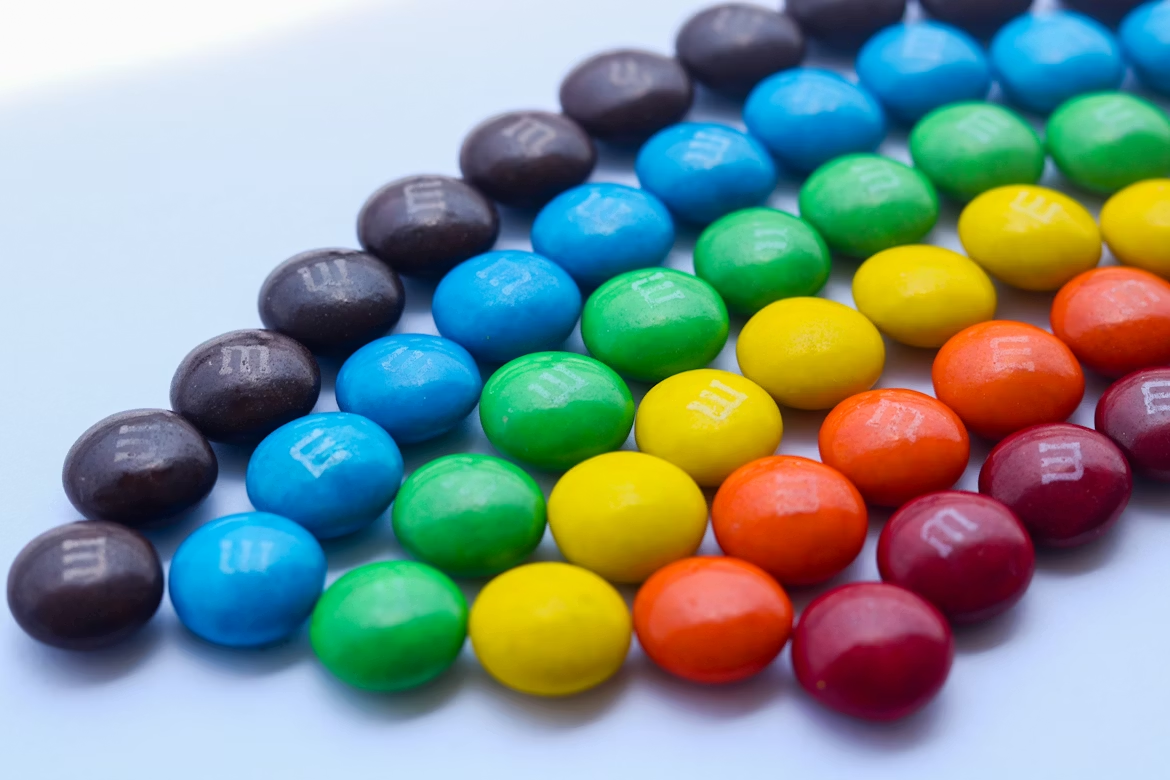
Are All Colors Equally Represented?
We counted the colors in our sample of 622 candies and used graph builder to create a pie chart:
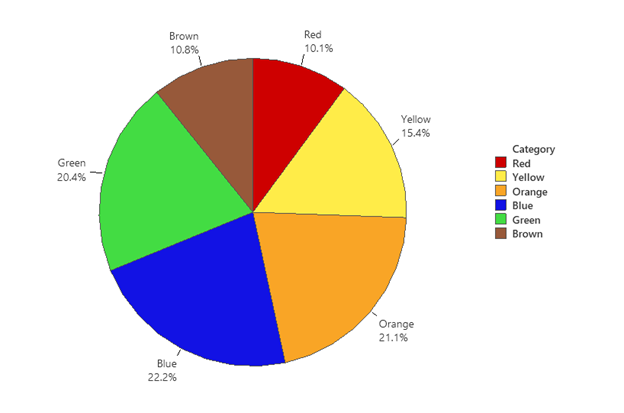
If all colors were equally distributed, we would expect about 104 of each color.
A chi-square goodness-of-fit test produced:
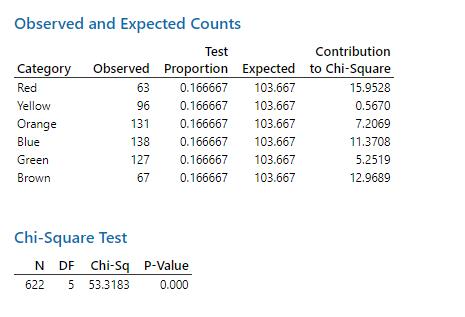
The p-value (0.000) proves the color distribution is not even. Some colors appear much more frequently than others in our sample.
Does More Candy Mean More Weight?
It seems logical that bags with more M&M’s would weigh more. To test that idea, we examined the relationship between count and weight.
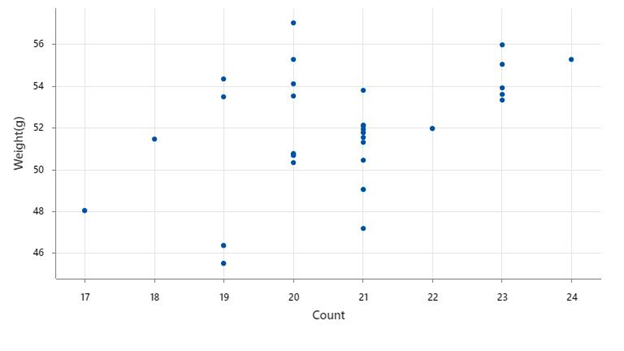
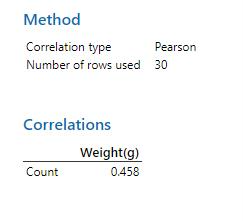
The scatterplot shows a clear upward trend: as the number of candies increases, so does the weight.
Is the Measurement System Reliable?
We also conducted a Gage R&R study, measuring 10 bags twice in random order.
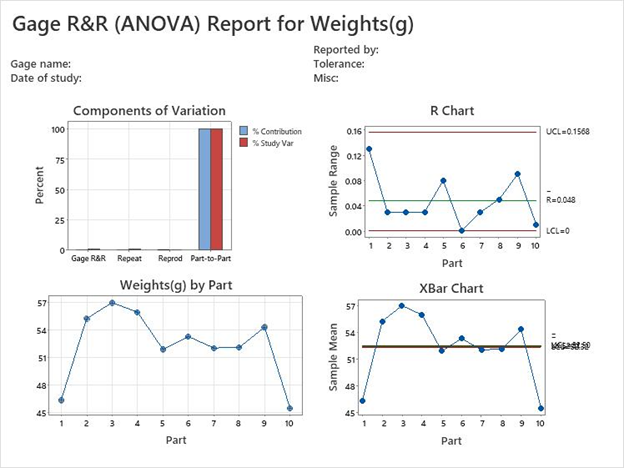
The total Gage R&R variation was 1.14%. Since this is well below the 10% benchmark, very little variation comes from the measurement process itself. The measurement system is considered acceptable.
Ready to apply this level of clarity to Healthcare?
This simple example shows how the right tools can quickly guide you
from a question to a defensible answer.
Now imagine that same structured approach applied to
clinical quality, operational performance, or patient outcomes.
Connect with a Minitab expert to explore how the Minitab Solution Center can support smarter, data-driven healthcare decisions.