
The Crisis Response Center (CRC) is a 24-hour mental health crisis center in Tucson, Arizona. Located within the Banner-University Medical Center South Campus, the CRC was created with Pima County bond funds in 2011 to provide a better alternative to jail and traditional emergency departments for patients with behavioral health needs.
“All too often, people in mental health crisis end up waiting for hours in medical emergency departments or worse, arrested and taken to jail, instead of getting the care they need,” said Dr. Margaret (Margie) Balfour, Chief of Clinical Innovation & Quality at Connections Health Solutions. “The CRC was created to provide a better solution for this population.”
Connections Health Solutions was asked to assume management of the CRC in April 2014 due to quality and safety concerns. Drawing upon their years of experience operating a larger crisis facility in Phoenix, Connections used Lean Six Sigma methods to redesign processes for evaluating, admitting and treating patients. Using Minitab Statistical Software, the Connections team was able to measure their success, which included significant improvements in the timeliness, quality of care, and patient experience overall.
The Challenge
By the time Connections arrived at the CRC, the busy center had been facing repeated complaints and investigations by the state of Arizona. Dr. Balfour and her team quickly identified many urgent operational challenges related to throughput, patient wait times, and safety.
The CRC serves 11,000 adults and 2,200 children every year. The patient population is comprised of 45 percent walk-ins, 45 percent from law enforcement, and 10 percent from outside medical emergency departments. To determine if someone who enters a crisis center meets the medical necessity for the 23-hour observation unit, they must assess patients on several factors including if they are a danger to themselves or others, acutely psychotic or agitated, intoxicated, or are going through withdrawal.
“For a lot of people in emergency rooms, there's no psychiatry services available, the only thing the ER can do is either send them home or admit them to the hospital,” she said. “Our philosophy is that most of those people don't need inpatient psychiatric hospitalization. If we start treatment early on our 23-hour observation unit, and really do aggressive stabilization and discharge planning, most of them can go home. Our data shows about 60 to 70 percent are able to go home the next day instead of the hospital.”
The Solution
Executive leadership engaged managers, frontline staff, and patients through town-hall meetings, rounding (a method of asking key questions to specific stakeholders to gain actionable information), and working clinical shifts alongside staff. They all agreed that the adult triage process was the highest priority.
The executive leadership, management, and frontline staff – including peer supports who had previously been patients at the CRC – mapped the baseline triage process, performed a gap analysis comparing their current process to the ideal, and developed new policies and procedures for clinical assessments, patient flow, and space utilization.
Now on the path to achieve their ideal state, they started with the initial check-in process. While previously patients began with two separate assessments – one with a behavioral health technician and one with a crisis worker – patients would now receive one streamlined assessment by a crisis worker who also categorized them as low-, medium- or high-risk. High-risk patients were admitted to the observation unit immediately while low- or medium-risk patients were brought back to the waiting room and would meet with a behavioral health medical professional (BHMP) or crisis worker as needed. A behavioral health technician was then freed from the separate assessments and could be placed earlier in the process, monitoring the waiting room at all times and giving patients brief medical screens and checking their vital signs in order to identify any acute medical issues.
The Results
Within three months of assuming management of the CRC, Connections was able to achieve a significant decrease in patients wait times, calls to security for behavioral emergencies, and staff injuries. Furthermore, the median door-to-door dwell time in the clinic decreased by 225 minutes and median door-to-door dwell time in the observation unit decreased by two hours even though 232 more patients per month were identified as high-risk and triaged to that unit. For the patients admitted to the observation unit, the door-to-doctor time decreased by 6.6. hours.
How Minitab Helped
Kathleen Tanner, the quality manager at Connections, used Minitab Statistical Software to analyze data from before and after the change in the triage process.
“A lot of the metrics that we gathered were throughput – time, order data,” she said. “A lot of the charts we did were charts based on time. We were measuring throughput from the time the patients arrived at the facility until they got back to a stabilization chair. That was really what we were trying to improve and we were actually very successful.”
Improvements were measured in two phases. Phase I, from July to September 2014, comprised most of the changes to the process described earlier. After the Phase I interventions, there continued to be long waits to BHMP assessment. To address this, they added an additional 12-hour BHMP shift assigned to the clinic beginning October 1, 2014 and measured a Phase II period from October to December 2014.
As shown in Figure A, the clinic door-to-door dwell time decreased following Phase I, and this improvement was sustained during Phase II. The increase in observation unit door-to-doctor time – where more patients were required to be evaluated by the BHMP – necessitated the Phase II interventions targeted at BHMP staffing, and then a reduction is shown in Figure B.
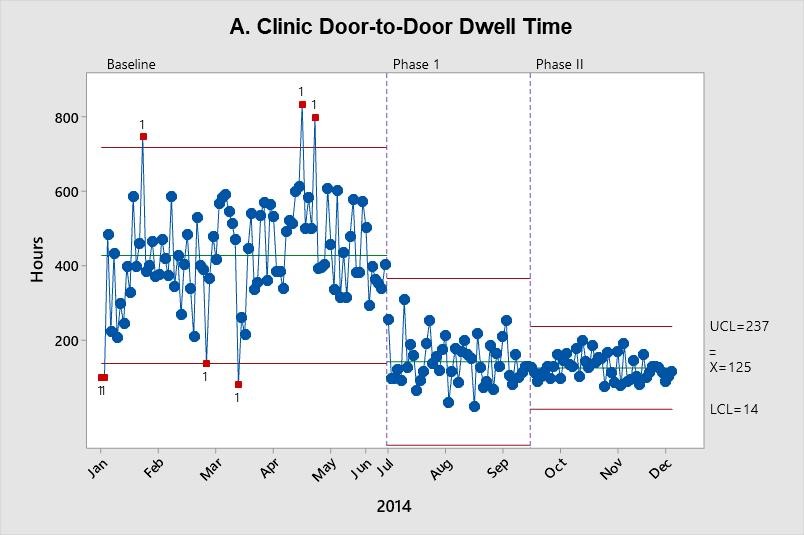
 represents the process mean. Upper control limits (UCL) and lower control limits (LCL) are set at three standard deviations above and below the mean, respectively.")
These X-bar charts depict improvement in throughput measures. Each data point represents the mean of a random sample of up to 100. The center line (X-bar) represents the process mean. Upper control limits (UCL) and lower control limits (LCL) are set at three standard deviations above and below the mean, respectively.
Kathleen also said being able to easily recalculate the limits was very helpful.
“It has statistical purposes but also, from a visual standpoint it's very powerful to be able to see not only that the mean is lowering and the data around it is lowering but also that limits are narrowing,” she said. “Minitab always had that capability and it's very compelling when you look at it.”
This case study is based on interviews with Margie Balfour and Kathleen Tanner and a study they co-authored that appeared in The Joint Commission Journal on Quality and Patient Safety.
Balfour ME, Tanner K, Jurica JS, Llewellyn D, Williamson RG, Carson CA. Using Lean to Rapidly Transform a Behavioral Health Crisis Program: Impact on Throughput and Safety. Joint Commission Journal on Quality and Patient Safety. 2017;43(6):275-283.
The Challenge
The Crisis Response Center in Tucson, Arizona was facing complaints that prompted an investigation by the state of Arizona, resulting in fines, sanctions, and a mandate to improve the safety and quality of care.
Products Used
Minitab® Statistical Software
The Solution
Executive leadership, management, and frontline staff identified the triage process first as their highest priority. They mapped the existing triage process, performed a gap analysis comparing their current process to the ideal, and developed new policies and procedures for clinical assessments, patient flow, and space utilization.
The Results
A significant decrease in patient wait times, calls to security for behavioral emergencies, staff injuries, and throughput times. Median door-to-door dwell time in triage decreased by 225 minutes, and median door-to-door doctor time in the observation unit decreased by 6.6 hours.
How Minitab Helped
Minitab Statistical Software was used to analyze data from before and after changes to the triage process, including an X-bar chart depicting improvement in throughput measures.