We speak engineer.
Behind every moment the world trusts…there’s an engineer. You’re solving problems the world never sees.
We see you.


The world depends on your decisions long before anyone sees the results.
Every safe journey. Every successful surgery.
Every product we take for granted.
It all starts with your ability to test, refine, and get it right.
You’re not just running analyses. You’re creating certainty.
We’re here to help you do it with clarity and confidence.
Your work demands decisions that stand up to pressure,
scrutiny, and real-world conditions.
You need tools that help you:
Find the real root cause before deadlines and production pressures take over.
Our solution
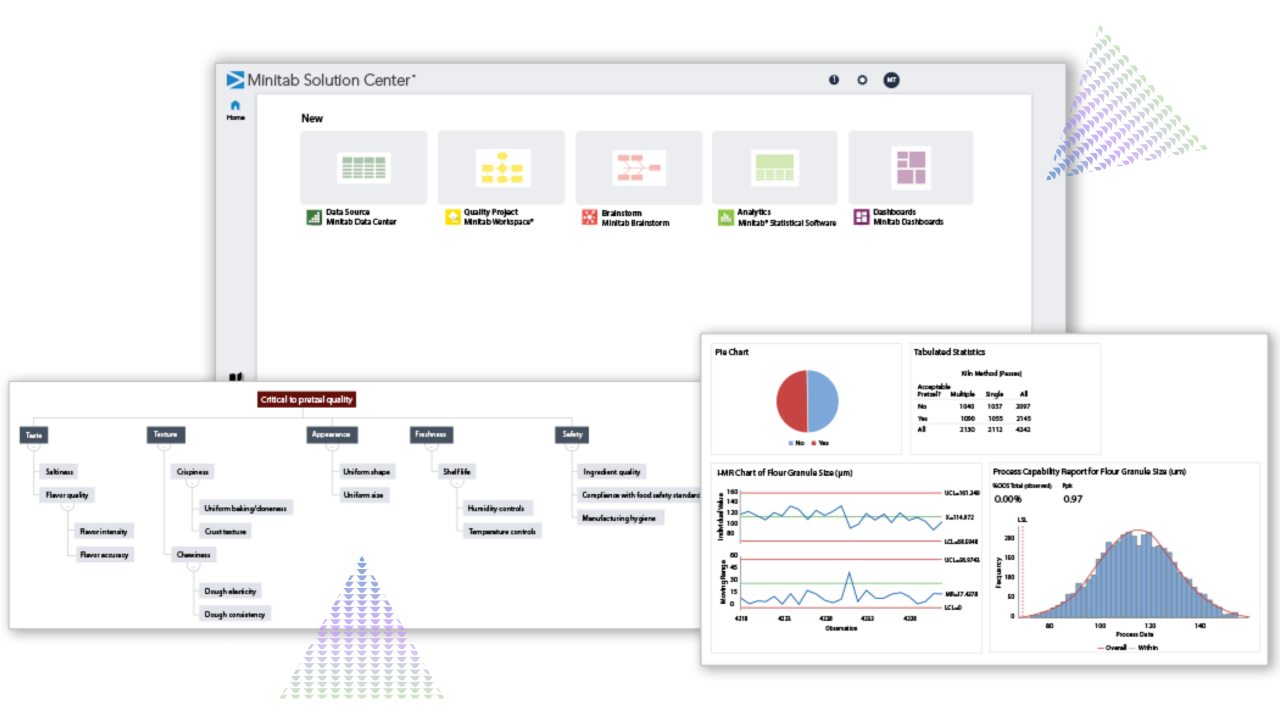
Guided analyses and proven statistical methods that reveal what’s really happening.
Communicate findings to teams and leaders who don’t speak the language of data.
Our solution
Clear reports, predictive insights, and visual storytelling that make your recommendations easy to understand and act on.
Prevent defects, downtime, and failures before they become costly problems.
Our solution
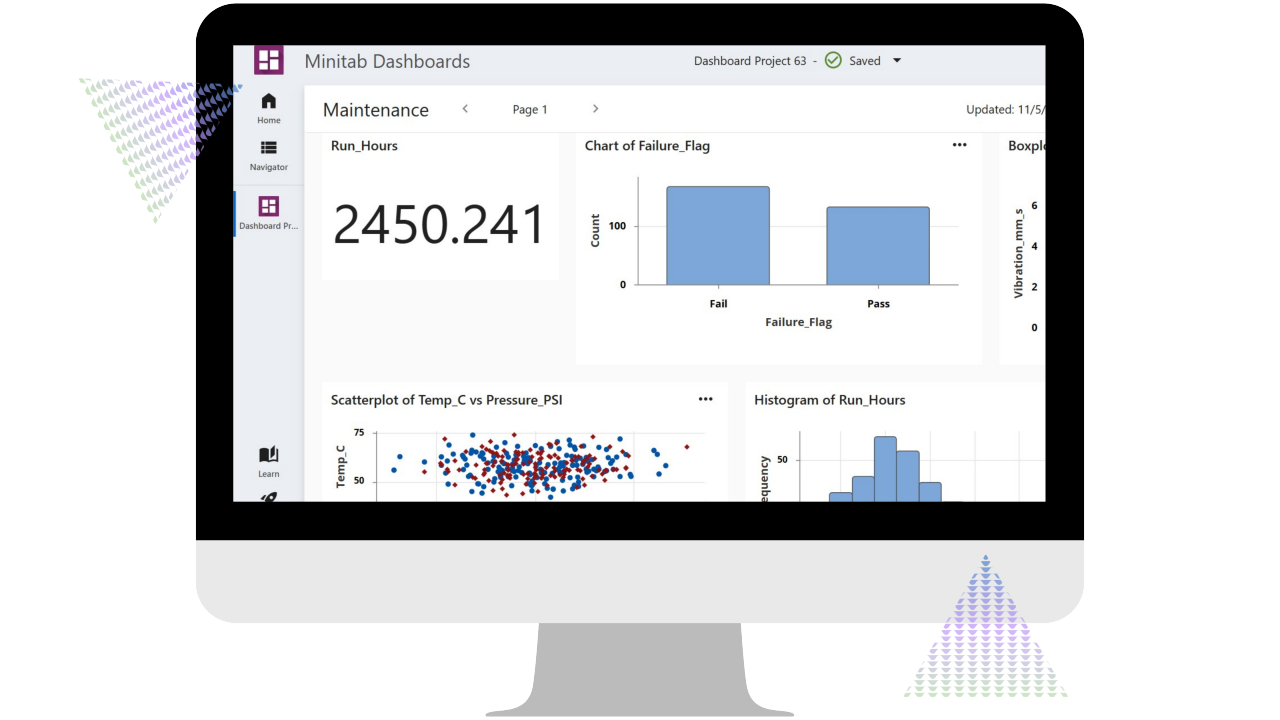
Live dashboards and alerts that help you spot issues early and maintain reliable processes.
Start solving bigger problems today.
Free resources engineers rely on to learn, improve, and make smarter decisions:
Your workflow—accelerated.
HOW IT WORKS
- 1. Import Your Data
- 2. Ask Better Questions
- 3. Make Decisions You Can Defend
From machines, tests, sensors, spreadsheets, and production systems—wherever your insights begin.

Use guided analyses, visualizations, and built-in expertise to see what others miss.
Confidently recommend changes backed by statistically sound evidence.
Trusted by engineers in organizations that move the world.
WHAT OUR CUSTOMERS SAY
“Minitab [is] the best tool for quality management. I use Minitab to run time series plots, charts, and control charts, as well as Pareto charts, fish bone charts…all the quality data was presented to upper management using Minitab. I would recommend it without hesitation!”
Jose Luis P.
Quality Chief
“Minitab helps me understand failure points and relationships within complex processes. The FMEA tool alone has saved us hours of discussions and calculations.
Our efficiency has gone up significantly.”
Rahul V.
Senior Development Engineer
“Minitab makes it so easy to analyze data—graphs, statistical analysis, reporting—it’s the best thing an engineer can ask for. You don’t need to be an expert to use it.”
Maria M.
Industrial & Manufacturing Engineer


We speak your language.
For more than 50 years, engineers have trusted Minitab to turn data into answers.
We simplify the complex and uncover insights that drive better decisions, stronger products, and more reliable processes.

With Minitab you can:
- Identify root causes in minutes
- Validate decisions with proven statistical methods
- Reduce waste, defects, downtime, and risk
- Standardize and scale best practices across your organization
- Communicate findings clearly, even to non-technical audiences
- Solve problems faster, even if you don’t know statistics
When the world depends on you, you can depend on Minitab.
Expert-grade analysis, without unnecessary complexity.
Join thousands of engineers who trust Minitab to help them solve problems, optimize processes, and deliver measurable results.
See what your data can do.