OneSteel은 40,000여종의 제품을 제조하여 건설, 제조, 주택, 광업 및 농업 부문의 약 30,000개 고객사에 유통합니다. 호주의 여러 곳에 위치한 시설에서 이 회사는 두꺼운 빔에서 얇은 강선에까지 이르는 다양한 제품을 생산합니다. OneSteel은 자사 시설 중 하나가 가공 중 뜨거운 강철의 표면이 공기 중의 산소와 반응할 때 형성되는 "흑피", 즉 산화철의 양에 큰 차이가 있는 로드를 생산한다는 사실을 발견했습니다. 값비싼 장비의 마모를 방지하고 최종 제품의 결함을 피하기 위해 흑피는 반드시 이후 공정 전에 제거해야 합니다. 약간의 흑피는 피할 수 없지만 과도한 흑피는 중대한 수율 손실을 초래합니다. OneSteel은 강봉의 흑피를 수용할 만한 수준으로 줄이기 위해 팀을 지정했습니다. 팀원들은 데이터를 분석하고 프로젝트의 성공을 입증하는 데 있어서 Minitab Statistical Software를 신뢰했습니다.
당면 과제
OneSteel의 원철은 제련 공정을 거쳐 최종 제품으로 완성되기 위해 한 시설에서 다른 시설로 이동합니다. 강선을 생산하기 위해 이 회사의 래버턴 강봉 제철소는 고온의 붉은 원철을 압연하여 얇은 강봉으로 만들고 나서 이후 공정을 진행합니다. 질롱(Geelong) 강선 제철소에서 이러한 강봉은 매우 낮은 온도로 가열된 후 금형을 통해 냉간 인발되어 특정 지름과 기계적 속성을 가진 강선으로 만들어집니다.

이 회사는 OneSteel의 Laverton Rod Mill 강봉의 "흑피"의 양이 회사의 제철소의 수율과 수익성에 영향을 미치기 시작하자 Six Sigma와 Minitab Statistical Software를 사용하여 해결책을 찾고 성공을 입증했습니다.
래버턴에서 강봉을 만들기 위해 강철을 최소 1038°C 이상으로 가열한 후 압연합니다. 강봉은 이후 수조를 통과하는데, 압연기를 통하여 이동하는 강봉의 표면이 물과 접촉함으로써 식혀집니다. 다음으로 강봉은 권취기(laying head)로 이송되어 고리 모양으로 성형됩니다. 이 고리들은 이송 컨베이어에 놓여 추가로 냉각된 후 코일로 누적됩니다.
로드 밀에서 고온 가공을 하면 "흑피"라는 산화철이 로드 표면에 형성됩니다. 흑피 수준은 사용되는 압연기의 유형, 강철의 온도, 그리고 가열된 상태가 유지되는 시간에 따라 달라집니다. 미세한 흑피 먼지 입자의 연마 특성은 인발 금형의 수명을 단축시키고 열악한 제품을 생산하는 결과를 초래할 수 있습니다. 따라서 강봉에서 강선을 성공적으로 생산하기 위해서는 우선 흑피를 반드시 제거해야 합니다. 지롱(Geelong) 강선 제철소는 역굽힘 흑피제거라고 하는 기계적 공정을 사용하는데, 여기서 강봉은 일련의 다발을 통과하게 됩니다. 굽힘은 취성 흑피가 연성 강철에 피해를 주지 않고 분리되어 떨어져 나가도록 하지만, 레버턴 강봉 표면의 흑피 수준은 종종 바람직한 기계적 흑피 제거 수준을 넘어 결국 수율 감소로 이어졌습니다. 과도한 흑피로 인한 추가 비용에는 그것을 세정하고 폐기하는 비용, 흑피 추출 시스템의 가동 및 유지보수와 관련된 비용, 그리고 가동율 저하, 금형 수명 단축, 윤활유 사용 증가 및 제품 품질 저하로 인한 잠재적 비용이 포함됩니다. 질롱(Geelong) 강선 제철소가 청소, 윤활유 및 금형에 한 해 동안 지출한 $815,000을 고려했을 때, 입고되는 강봉에서 흑피의 양을 줄이는 것은 OneSteel에 막대한 비용 절감을 가져다 줄 잠재력을 가지고 있었습니다.
Minitab을 활용한 사례
Six Sigma Black Belt Brett Perrin과 공정 소유자 Shanti Arangala는 챔피언 Brian O’Connell의 지원을 받아 강봉 및 강선 제철소의 교차 기능 팀과 프로젝트를 시작했습니다. 이 팀에는 기술 관리자, 공정 엔지니어, 품질 전문가, 금속학자 및 장비 운영자가 포함되었습니다.
DMAIC(Define/정의, Measure/측정, Analyse/분석, Improve/개선, Control/관리) 방법론은 사용하여 프로젝트 팀은 전체 철강선 생산 공정을 조사하여 95% 미만의 흑피제거 수준을 갖는 강봉을 불량 강봉으로 정의했습니다. 이후 그들은 레버턴에서 질롱(Geelong) 강선 제철소로 입고되는 강봉의 표본 추출을 진행했습니다.
OneSteel의 프로젝트 팀이 레버턴 제철소에서 오는 강봉의 흑피를 측정하고 관련 데이터를 Minitab에서 분석했을 때, 그들은 그들이 테스트한 샘플의 62%가 수용할 수 없는 높은 흑피 수준을 갖는다는 것을 발견했습니다.
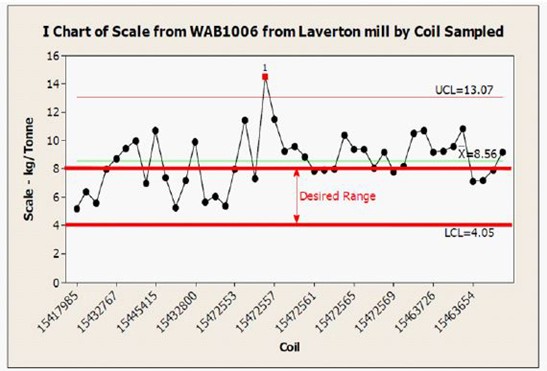
팀은 흑피 무게를 전체 제품에 대한 비율로 kg/Tonne 단위로 측정했습니다. 그들이 테스트한 샘플의 62%가 최대 톤당 3kg의 유의미한 편차와 함께 톤당 7kg을 초과하는 흑피를 가지고 있음을 발견했습니다. 이는 톤당 1kg의 편차만으로도 $75,000 가치의 수율 손실이 발생하기 때문에 이는 상당한 수율 손실을 초래합니다. 질롱 플랜트에서 과도한 흑피로 인한 추정 손실은 연간 약 $220,000로 추정되었습니다.
프로젝트 기간 동안 팀원들은 Minitab을 사용하여 그들의 데이터를 분석했을 뿐만 아니라 그 결과의 유의미성도 공유했습니다. 일례로, 그들은 강봉의 등급에 따라 서로 다른 흑피 무게를 증명하기 위해 Minitab의 2-표본 t-테스트를 사용했을 뿐만 아니라 정보를 시각적으로 공유하기 위해 박스 플롯을 사용했습니다.
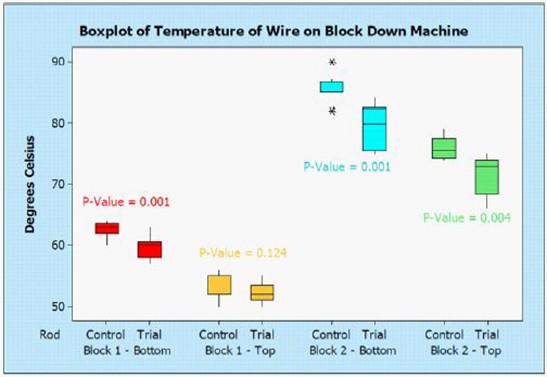
관리 및 시험 조건 하에 수집된 기계 온도 데이터의 박스플롯은 시험 운전에서 얻은 저온을 생생하게 보여줍니다.
그들은 권취기(laying head) 온도와 흑피 무게 사이의 관계를 파악하기 위해 Minitab의 강력한 회기 분석을 사용하였고, 또한 그러한 관계를 시각적으로 표시하기 위해 소프트웨어의 산점도(Scatterplot)를 사용했습니다.
또한 팀은 Minitab의 확률밀도함수(Probability Density Function)를 적용하고 실제 데이터를 샘플링하고 그것을 바람직한 결과와 비교하여 감소된 편차와 줄어든 흑피 무게로 인해 축적될 수 있는 잠재적 절감액을 확인했습니다.


Minitab의 강력한 그래픽을 통해 프로젝트에 참여한 모든 사람은 시험 운전(적색)과 관리 운전(흑색) 사이에서 금형 마모의 차이를 쉽게 확인할 수 있었습니다.
파레토 분석은 어떤 강봉 등급이 강선 인발 기계에서 지연을 초래하는지를 결정할 수 있게 해주었습니다. "Minitab은 제한된 데이터 조작으로 이를 매우 빠르게 수행할 뿐만 아니라 프레젠테이션에서 효과적인 커뮤니케이션 도구인 매우 명확한 그래프도 제공합니다."라고 Perrin은 말합니다.
레버턴 강봉 제철소에서 강봉을 생산하는 데 사용된 투입물의 특성을 변경하는 것은 선택할 수 있는 대안이 아니었기 때문에, 팀은 강봉 흑피의 백분율을 낮추고 강선 제철소의 수율을 증진하기 위한 다른 방법을 모색했습니다. 그들은 강봉 제철소에서 사용된 냉각 프로세스, 강선 제철소에서 사용된 흑피 제거 및 인발 관행, 그리고 양쪽 제철소 모두의 운영 매개변수를 포함하는 테스트 요소들에 대한 시험을 진행했습니다.
먼저 그들은 냉각 컨베이어 매개변수가 강봉에서 흑피의 양에 미치는 영향을 평가하기 위한 테스트를 진행했습니다. 또한 그들은 강봉 제철소에서 강선 인발 블록과 권취기(laying head)의 온도를 측정했습니다. Minitab 분석은 냉각 컨베이어에서 온도를 30% 낮추었을 때 유의미한 차이를 보여주었습니다.
다음으로 그들은 수율에 대한 인발 방법의 효과를 테스트했습니다. 관리 운전과 시험 운전을 위해 팀은 새로운 금형, 각 금형에 대한 새로운 윤활유, 흑피 제거 장치의 새로운 브러시를 갖춘 생산 라인을 설정하고 운전 속도를 일정하게 유지했습니다. 시험 매개변수를 사용하여 운전한 결과, 더 낮은 온도, 더 깨끗한 제품, 더 적은 금형 마모, 그리고 덜 가시적인 흑피가 나타났습니다. 강도 테스트에서는 시험 제품 및 관리 제품의 품질 사이에 아무런 통계적 차이도 나타나지 않았습니다.
그들은 강선 인발 기계에서 금형 마모를 측정했고, 새로운 매개변수가 인발 금형의 수명에 획기적으로 영향을 미치는 사실도 발견했습니다. 한 테스트에서 운전을 시작할 때 금형의 지름은 6.22mm이었습니다. 관리 강봉을 사용하여 15톤의 강선을 인발했을 때, 금형의 지름은 거의 6.32mm에 도달했습니다. 시험 강봉을 사용한 라인에서 금형의 마모는 획기적으로 줄었는데, 15톤의 인발 후 금형의 지름은 6.24mm이었습니다.


테스트 전과 후에 수집한 데이터의 분석에서 레버턴 강봉 제철소의 권취기(laying head)에 대한 보정 절차에 개선 효과가 있음을 보여주었습니다. 보다 정확한 "실제" 온도 추정치는 제철소가 로드의 스케일 수준이 허용 가능한 범위 내에 있는지 확인하는 데 도움이 됩니다.
다양한 개선을 구현한 후, 팀은 Minitab을 사용하여 최근 인발한 7mm 강선에 대한 흑피 무게 및 권취기(laying head) 온도 모두를 분석했습니다. Minitab의 분석에서 강봉 제철소는 과거보다 흑피로 인한 수율 손실이 훨씬 더 적고 기계적 흑피 제거에 적합한 강봉을 생산할 수 있음이 확인되었습니다.
팀은 Minitab을 사용하여 제철소에서 수행한 시험의 효과를 명확하게 보여주는 관리 차트를 만들었습니다. 이는 시험의 결과물을 프로세스 책임자와 공유하는 효과적인 방법이었습니다.
결과
팀의 노력 덕분에 레버턴 강봉 제철소의 냉각 공정이 개선되었습니다. 이제 작업자들은 냉각 개시 온도를 더 수월하게 조절할 수 있게 되었으며, 개선된 냉각 공정이 강봉의 흑피 중량을 상당히 줄여 준다는 사실을 Minitab 분석을 통해 확인하였습니다.
오른쪽의 Minitab 히스토그램은 로드 밀의 보정 절차를 개선하여 추정 "실제" 온도와 더 근사치로 보고된 온도의 결과를 보여줍니다. 이는 이전의 압출과 비교하여 실제 권취 온도가 낮아지고, 이렇게 낮아진 권취 온도가 흑피로 인한 수율 손실량을 줄여 강봉 제철소 고객을 위해 도움이 된다는 결과를 보여줍니다.
질롱(Geelong) 강선 제철소는 레버톤으로부터 훨씬 더 깨끗하고 시각적으로 탁월한 새로운 강봉 제품을 제공받게 되었습니다. 흑피량 감소와 수율 증가의 결과로서, OneSteel은 연간 대략 $235,000의 자재비 절감에 더하여 $40,000의 노동비와 소모품비를 절감하는 효과를 예상하고 있습니다. 흑피량 감소는 또한 추가적인 다운스트림 공정에 편익을 제공합니다.
개선 사항을 확인한 OneSteel의 프로젝트 팀은 그들의 DMAIC 프로세스에서 관리 단계에 들어갔습니다. 그들은 공정 절차 및 유지보수 활동에 대한 개선을 확립하여 그러한 개선을 수월하게 지속하고 향후 계속적인 절감을 보장하기 위해 Minitab의 관리 차트를 사용하고 있습니다. 한편 OneSteel의 식스 시그마 사무국은 그들의 글로벌 운영의 모든 분야에서 효율성과 수익성을 촉진하기 위해 품질 개선의 능력(그리고 Minitab Statistical Software)을 적용할 수 있는 새로운 방법을 모색하고 있습니다.

조직
OneSteel
개요
- 철강 중간재 및 철강 완제품의 글로벌 제조 및 유통 회사
- 본사 주소는 호주
- 호주 달러 74억불의 연간 매출
- 11,500명 이상의 전세계 직원
당면 과제
와이어를 만드는 데 사용되는 강봉의 "흑피"를 줄입니다.
사용 제품
Minitab® Statistical Software
결과
- 연간 $275,000 이상의 비용 절감
- 기계 마모 감소
- 시각적으로 개선된 제품