Some things are easy to measure, but fairness can be difficult to gauge. Without a standard metric, reconciling people’s different ideals can be problematic—especially in the workplace. One employee’s fairness may be another’s perceived injustice, so establishing objectively fair procedures can be challenging.
One of Thailand’s leading sugar manufacturers, Thai Roong Ruang Sugar (TRR) Group, assessed its employee performance review process to address concerns about inconsistent department head standards for employee evaluation. Using Minitab Statistical Software to examine reviews in each department across its three sugar factories, the company’s human resources manager investigated the significant differences between evaluation scores and designed a new appraisal form to eliminate differing standards of fairness. Data analysis closed the gap between the department leaders’ inconsistent standards or possible bias toward their employees and the new, standardized criteria that established guidelines for fair compensation.
The Challenge
TRR Group’s human resources (HR) department sends standard evaluation forms to department managers for use during the company’s annual review process. Managers use the forms to assess each employee under their supervision and return the forms to the HR department upon completion. The review scores employees receive help TRR Group determine salary adjustments, bonuses, and improvement plans.

A project team at TRR Group assessed the employee performance review process at three of the company’s sugar refineries and standardized the criteria for evaluations. Using Minitab Statistical Software, the team established guidelines for fair compensation and eliminated the potential for unfair treatment.
The appraisal forms ask managers to rate workers based on their performance. Without a method for determining how each manager measures employee competence, TRR Group needed to be certain it could rely on these subjective evaluations to make decisions.
Both unusually high and low scores drew the attention of the HR manager responsible for TRR Group’s three sugar refineries. Using statistical methods to explore the data, he set out to understand the differences in the departments’ employee reviews across factories and explain the outliers. Depending on what the data revealed, the appraisal form might need to be revamped in order to standardize how managers measure employee performance and ensure equality in the evaluation process.
How Minitab Helped
“This project’s greatest challenge was convincing TRR Group’s management that using the same evaluation criteria for each department led to varying judgments by the supervisors,” says Veerasak Suriyakrai, project leader and HR manager. He used tools in Minitab, such as histograms and boxplots, to identify and illustrate the number of outlier scores among the employee evaluations—evidence that could point to unfair or preferential treatment by supervisors, or simply differing views among the managers about how employee performance should be scored.
Because outliers that appear on one graph may not be obvious on a different graph, using both a histogram and a boxplot to examine the frequency of certain evaluation scores for each department ensured that no outlier was overlooked. The graphs were easily combined in a summary for comparison.
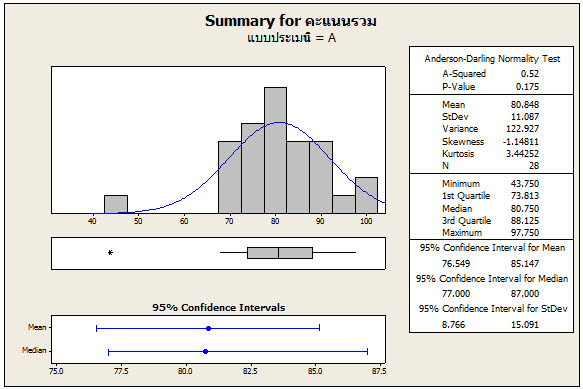
In the summary for Department A, above, an outlier is visible on both the histogram and the boxplot. Identifying outliers helped focus project efforts on departments demonstrating potential bias or differing scoring standards among supervisors.
After using the graphs to verify which departments needed further examination, the HR manager displayed employee review data in a probability plot in order to evaluate the fit of its distribution.
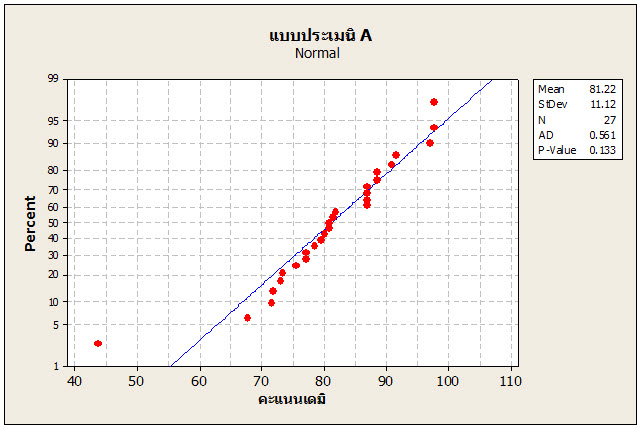
The probability plot above shows the data for Department A approximately follow a normal distribution, with one obvious outlier in the department’s employee reviews.
The data from each department were displayed on probability plots to determine distribution fit. Because the data in the probability plots for each department approximately aligned with the fitted normal line, they met the criteria for hypothesis testing. The hypothesis tests highlighted the differences in each department’s scores across the three companies and enabled Suriyakrai to verify the validity of his suspicions about the evaluations. Minitab’s hypothesis test output included graphs as well as a p-value that indicated a statistically significant difference between evaluations at the three factories.
Armed with the results of his analysis, Suriyakrai was able to make a strong case to management regarding the need to improve their evaluation methods, and the clarity of Minitab’s output helped him make a convincing argument. “Management didn’t understand what I was doing, so communicating the results effectively was critical to the project’s success,” says Suriyakrai. “The p-values were excellent evidence in our debates.”
Results
Ultimately, data analysis helped reduce the potential for bias and ensure that TRR Group’s standardized review process provides equal opportunities for each employee to advance within the company.
The analysis convinced TRR Group’s management that their performance appraisal form was flawed, and led to the design of a new, more accurate and effective evaluation form. With the HR department more comfortable with the validity of the information managers were reporting, Suriyakrai was able to confidently provide management with a fair compensation and development plan based on data across TRR Group’s three sugar refineries. The next steps will be to extend these findings to all seven subsidiaries.
The project has also sparked discussions about offering statistical training for techniques like design of experiments (DOE) to other areas of TRR Group, such as the HR team, production engineers, and quality control personnel. “I tell them about the benefits of incorporating Minitab into their processes, and how making decisions based on data improves the quality of work,” Suriyakrai says. For TRR Group, it seems natural to extend the benefits and successes of data analysis they’ve experienced in new ways across the company.
Organization
Thai Roong Ruang Sugar Group
Overview
- Leading sugar manufacturer and exporter in Thailand
- Founded in 1946
- Continually engaged in research, modification, and improvement of machinery and equipment for sugar production
- Seven subsidiary companies in related industries, including sugar refining, molasses processing, ethanol energy and manufacturing
Challenge
Standardize employee evaluations in order to minimize bias among department managers and eliminate the potential for unfair treatment.
Products Used
Minitab® Statistical Software
Results
- Standardized criteria for employee evaluations in all departments across TRR Group’s three sugar factories
- Established guidelines for fair compensation
- Helped plan for each employee’s personal development with reliable evaluations