Via Christi Health is the largest provider of healthcare services in Kansas and has served the area for more than 100 years. The health system delivers hospital care, senior villages, and other health services throughout Kansas and northeast Oklahoma.
With the launch of Via Christi’s Center for Clinical Excellence, the healthcare provider created a team of 5 people, all with Lean and Six Sigma training. Their assignment was to use data analysis to achieve higher levels of efficiency and diminishing rates of error, and each of the new team members were assigned to a process improvement initiative. Via Christi wanted the process improvement teams to find ways to make its operations more efficient and patient care more consistent, while ensuring that patient safety remains the top priority. Focusing first on areas at Via Christi hospitals that treat patients with the most urgent care needs, improvement teams tackled projects involving emergency department processes, surgery patients, heart failure patients, and patients with pneumonia. To perform the data analysis these projects required, Via Christi process improvement teams relied on Minitab Statistical Software.
The Challenge
With more and more patients being served by the system, Via Christi Health sought to make their services as efficient as possible. For example, the emergency departments (ED) at Via Christi Health adjusted various reporting processes for tracking patients through the different areas of the ED, made leadership changes, reallocated hospitality staff, and reduced the total number of beds in the ED’s intensive care unit.

Via Christi Health, the largest provider of healthcare services in Kansas, launched its Center for Clinical Excellence in September 2012. Shown above is the Black Belt team at Via Christi Health (Pictured: (back row) Zach Lewis, Ron Herter, Rob Dreiling, (front row) Laura Thompson, and Audrey Henning).
One performance improvement team then set out to determine if these changes actually improved the patient experience in the ED and helped the department get closer to its goals.
How Minitab Helped
“We had access to the raw patient throughput data from several months before the process changes were made, as well as from the first few months after the changes were made,” says Zach Lewis, process improvement specialist for Via Christi Health. “Then we used Minitab to analyze that data, which helped us to verify if the process changes really made a difference in improving the throughput time in each area.”
The team analyzed the data using various charts in Minitab, including Individuals and Moving Range (I-MR) charts, histograms, boxplots, and interaction plots, as well as calculating the descriptive statistics on the raw throughput time data—including mean and standard deviation to make before-and-after comparisons, and performing an analysis of the before and after mean times.
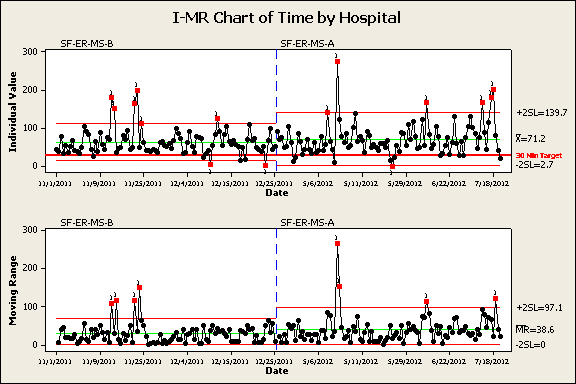
The I-MR chart above allowed the team to compare the before and after throughput times and the process variation by area. This particular chart showed a slight average increase of around 8 minutes and greater variation after the changes were made to the process.
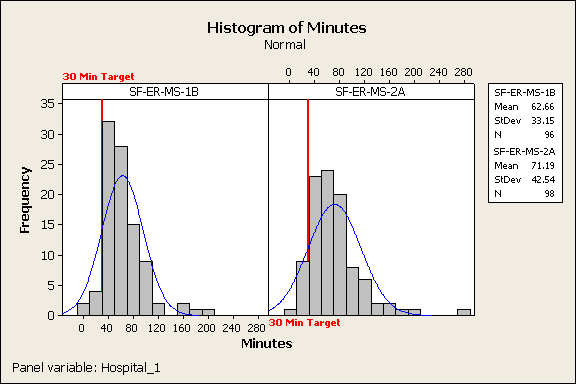
To compare the shape and spread of the time data before and after changes were made, the team built histograms in Minitab. The histograms above showed that the majority of patient throughput times (both before and after changes) surpassed the mean target time of 30 minutes. In addition, the histograms showed that the mean increased after the changes were made, again by around 8 minutes for this particular ED area. Histograms were also used to see if a certain day of the week or shift resulted in more variation.
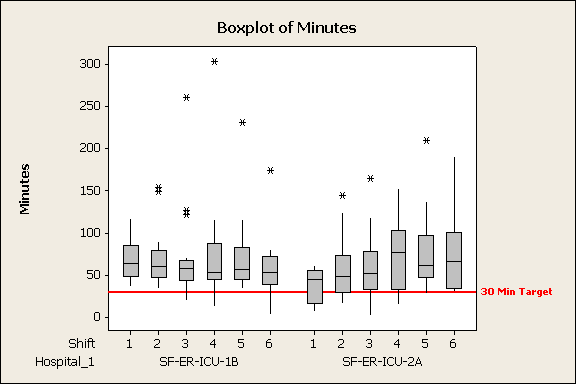
The team also used boxplots to assess and compare the mean throughput times by shift before and after process changes were made. For this particular change, the mean throughput times decreased slightly across all ED shifts.
What else did the data analysis reveal? After changes were made in the ED, there was only a slight improvement to the mean patient throughput time in two of the four ED areas where process changes were explored. In the two other areas where process changes were made, there was actually an increase in the mean throughput time.
“Although two areas showed slight improvement and two areas showed decline, statistically there was no significant difference between the before and after results by ED area,” says Rob Dreiling, process improvement specialist at Via Christi Health, who assisted with this project. “Our gut was telling us that the process changes had made such great improvements in the mean patient throughput times, but the data said otherwise.”
Results
This project certainly yielded surprising results to the emergency department team who had implemented the original changes to the process.
“The graphs and charts helped us show the emergency department team what the data was really saying—the changes weren’t statistically significant,” Dreiling says. “We were then able to help them look at improvement projects in a different way. Instead of jumping in and just trying a change to the process, we taught the team to map the process from beginning to end and then use statistics to start focusing on the right areas, so the projects will make a meaningful difference and we’re getting the most bang for our buck.”
When Rob and Zach dug further into what specific activities may cause the patient throughput time to increase, they gathered data around the time of day patients arrived and compared the patient and the staff load for turning around the emergency department rooms, which included cleaning the rooms in preparation to receive a new patient.
“Analyzing this data helped us recommend to the ED team that readjusting the cleaning crew shifts to better align with the peak patient throughput times would allow for rooms to be cleaned out as soon as the patient left, rather than having unclean, unusable rooms sitting empty for long periods of time,” adds Lewis.
Laura Thompson, Director of Process Improvement, says that although the Lean and Six Sigma effort at Via Christi is relatively new, many processes that affect patient care have been improved and higher levels of efficiency have been achieved.
“The entire staff has been phenomenal and receptive to our recommendations and supportive of what we’re trying to do,” Thompson says.
Organization
Via Christi Health
Overview
- Largest provider of healthcare services in Kansas
- Offers hospitals, doctors, senior villages, and other health services
- Employs more than 10,000 across Kansas and northeast Oklahoma
Challenge
Determine if process changes decreased the patient throughput time of the emergency department.
Products Used
Minitab® Statistical Software
Results
- Used data analysis to confirm that some process changes actually increased patient throughput time in certain emergency department areas.
- Worked with teams to structure improvement projects and use statistical analysis for those projects.
- Offered several recommendations to improve patient throughput times.