Participants explore the data analysis techniques necessary to understand variation and defects, claim equivalence, conduct multi-vari studies, determine the shelf life, evaluate and certify measurement systems, validate a process is capable of meeting customer specifications, and monitor the stability of a validated process. Emphasis is placed on all applications that will help you make sound business decisions to ensure you are providing the best quality product to your customers. Analytical and statistical principles will be presented through case studies, examples, and exercises.
This course is most appropriate for process engineers, R&D team members, and other quality professionals who need to understand how to apply analytical and statistical tools to a pharmaceutical process.
Training Track
- Minitab Essentials for Pharmaceuticals
- Statistical Quality Analysis for Pharmaceuticals
- Factorial Designs for Pharmaceuticals
- Workshop
DAYS 1-2
In this 2-day foundational course, you will learn to minimize the time required for data analysis by using Minitab! With Minitab, you will practice importing data, developing sound statistical approaches to explore data, creating and interpreting compelling graphs, and finally, exporting results. Discover how to analyze a variety of real-world pharmaceutical data sets to practice aligning your applications with the right statistical tool and interpreting statistical output to reveal problems with a process or evidence of an improvement. Learn the fundamentals of important statistical concepts, such as hypothesis testing and confidence intervals, and how to uncover and describe relationships between variables with statistical modeling tools.
This course places a strong emphasis on making sound decisions based upon the practical application of statistical techniques commonly found in the pharmaceutical industry.
Topics Include:
- Importing and Formatting Data
- Bar Charts
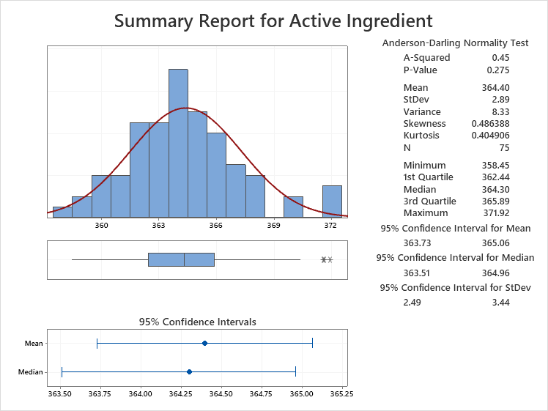
- Histograms
- Boxplots
- Pareto Charts
- Scatterplots
- Tables and Chi-Square Analysis
- Measures of Location and Variation
- t-Tests
- Proportion Tests
- Tests for Equal Variance
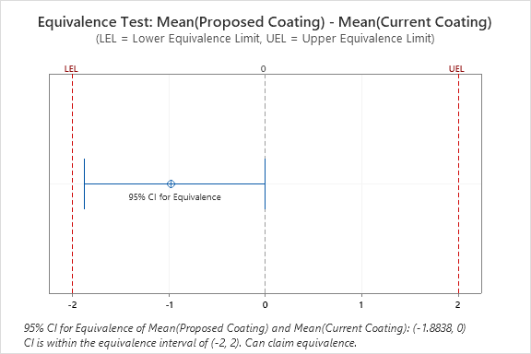
- Equivalence tests
- Power and Sample Size
- Correlation
- Simple Linear and Multiple Regression
- Stability Analysis
- One-Way ANOVA
- Multi-Variable ANOVA
Prerequisites: None
DAY 3
Get ready to develop the skills to successfully evaluate and certify measurement systems! You will learn the fundamentals of statistical process control and how these important quality tools can provide evidence to improve and control pharmaceutical processes. Practice the skills to know when and where to use the various types of control charts available in Minitab for your own processes. Plus, learn how to utilize important capability analysis tools to validate your processes, relative to internal and customer specifications.
The course emphasis is placed on teaching quality tools as they relate to pharmaceutical processes.
Topics Include:
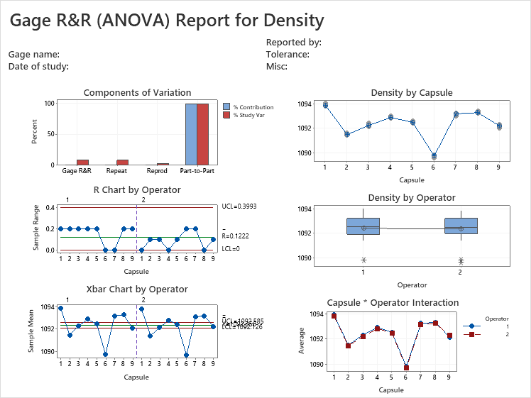
- Gage R&R
- Destructive Testing
- Gage Linearity and Bias
- Attribute Agreement
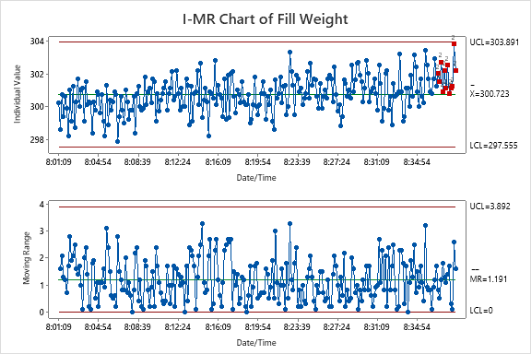
- Variables and Attribute Control Charts
- Capability Analysis for Normal, Nonnormal, and Attribute data
- Acceptance Sampling
Prerequisites: Minitab Essentials for Pharmaceuticals
DAY 4
In this course, you will learn to generate full and fractional factorial designs using Minitab’s intuitive DOE interface. Real-world medical device applications demonstrate how the concepts of randomization, replication, and blocking form the basis for sound experimentation practices. You will develop the skills to correctly analyze the resulting data to effectively and efficiently reach experimental objectives.
We’ll use Minitab’s customizable graphical displays to interpret and communicate experimental results. The results can be used to improve products and processes, find critical factors that impact important response variables, reduce process variation, and expedite research and development projects.
Topics Include:
- Design of Factorial Experiments
- Normal Effects Plot and Pareto of Effects
- Power and Sample Size
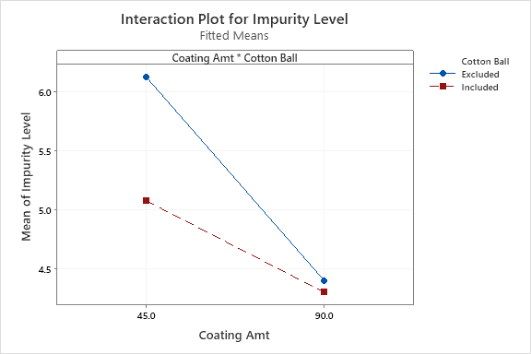
- Main Effect, Interaction, and Cube Plots
- Center Points
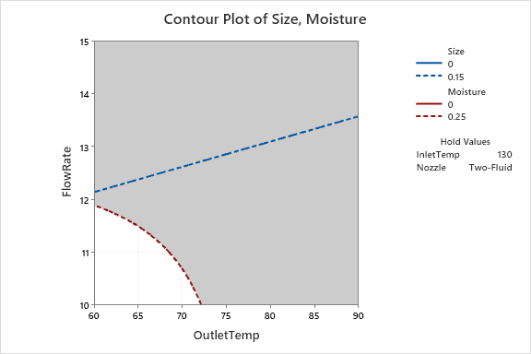
- Overlaid Contour Plots
- Multiple Response Optimization
Prerequisites: Minitab Essentials for Pharmaceuticals
DAY 5 - Optional
Minitab training provides the foundation for improving your efficiency to use statistics to analyze data. The examples present real-world scenarios to learn the tools, while the exercises allow time to practice. Bring your educational journey full circle by reinforcing the training using data from your company. This affords the attendees the opportunity to relate directly to their own use cases.
The workshop places strong emphasis on making sound decisions based upon the practical application of statistical tools to your company projects with your data.
Topics will be determined by the specific customer data brought to the workshop.