Document
Minitab Statistical Software Brochure ›
Harness your Data for Better Decision Making

Our Statistical Analysis Solutions
With Minitab’s software, you can easily make data-driven decisions. Our market-leading, flexible, and user-friendly statistical software helps you explore and investigate your data. You can discover insights, predict outcomes, and improve your results.

As the market leader in statistical software, Minitab prides itself on providing powerful solutions for everyone, no matter how early or advanced they are on their analytics journey.
Data Exploration
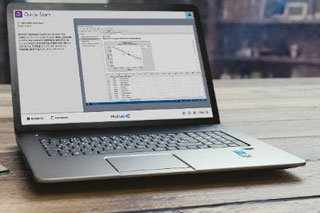
Data exploration is an early step in data analysis, typically to uncover patterns, characteristics, and points of interest. By using interactive visualizations, users can quickly explore their data and identify areas or patterns to dive into for further analysis. Minitab’s proprietary Graph Builder was built to accelerate and facilitate data exploration with an interactive and easy-to-browse gallery that lets you seamlessly switch from one graph to the next, using the same data and without re-running your analysis. Instantly, visualize and explore your data.
Minitab’s state-of-the-art graph builder can be used for data exploration and for learning new statistical visualizations that will make your analysis clearer and more powerful.
Descriptive Statistics
Descriptive statistics, which describes the properties of sample and population data, is used in our daily personal and business lives. Descriptive statistics is a way to organize, represent, and describe a collection of data, using tables, graphs, and summary measures, including popular parameters such as mean (average), median, or standard deviation. Descriptive statistics also are powerful tools to measure things like frequency, dispersion, and measure of position (like percentile or quartile ranking). Minitab provides all the descriptive statistical tools you need to analyze your data and differentiate yourself by providing additional context and statistics around your daily work.

Regression
Predictive analytics is a category of data analytics aimed at making predictions about future outcomes, based on historical data and analytics techniques. Minitab provides a variety of statistical techniques (including data mining, machine learning, and predictive modeling) to understand future occurrences. Regression modeling is one of the most popular tools around, and often many professionals’ first foray into predictive analytics.
For more advanced statisticians, we offer data science tools and a more advanced predictive analytics module.
Read about building, verifying and visualizing a regression model in Minitab Statistical Software.
Advanced Predictive Analytics
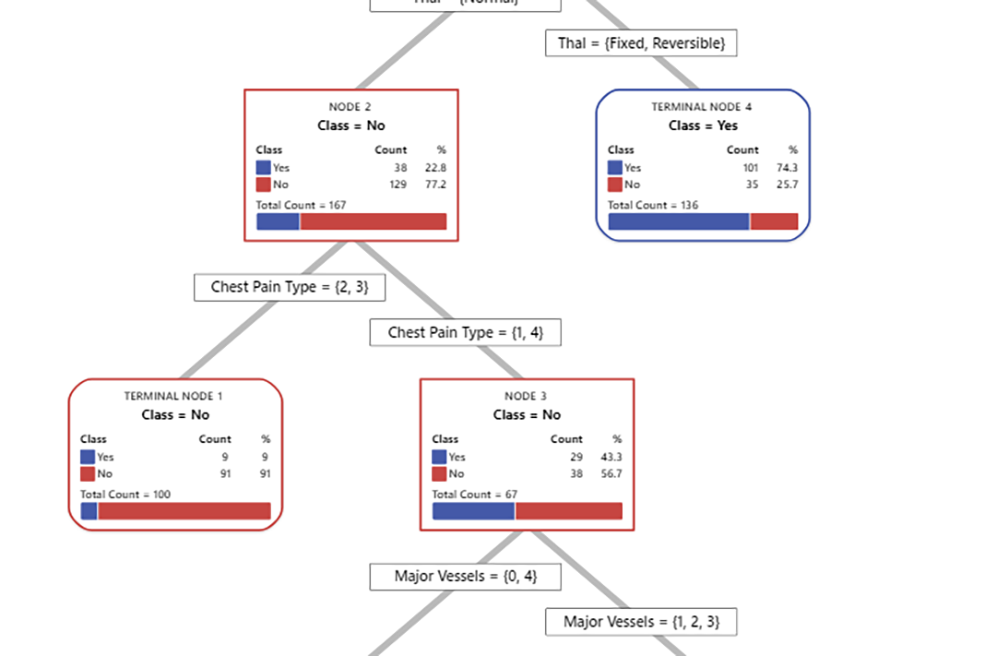
If you’re serious about leveraging predictive analytics to solve everyday challenges, then boost your analytical power with best-in-class, accurate machine learning algorithms! They provide deeper insights into your data. In addition to providing traditional statistical methods, we’ve made more advanced methods like tree-based methods more accessible to everyone.
Take your regression skills out of this world with MARS® (Multivariate Adaptive Regression Splines) or advance your skills by using our tree-based methods like Classification and Regression Trees, better known as CART®, Random Forests®, and gradient boosting, better known as TreeNet®. Not sure what method to choose? Easily confirm you're using the best predictive model to answer your question with Automated Machine Learning (Auto-ML). Perfect for those who are new to predictive analytics and need recommendations, and experts looking for a second opinion.

Quality Tools
Minitab is the market leader in quality tools because of the vast array of powerful tools we offer, the ease of using them, and the training and education we provide to help organizations continuously improve. Minitab sets the standard for quality analytics tools, such as Statistical Process Control, including Control Charts and Capability Analysis, Measurement System Analysis. In addition to statistical methods typically used in quality improvement, Minitab also offers Brainstorming tools and FMEAs.

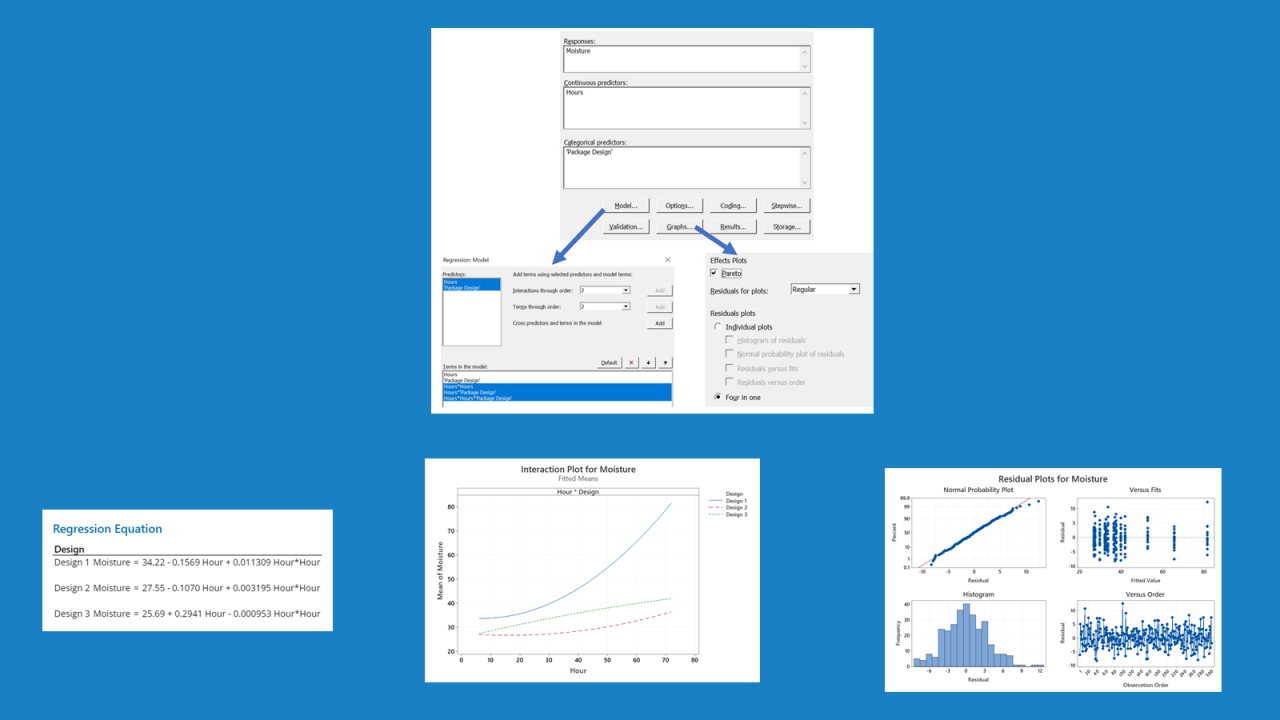
Design of Experiments
You probably know Design of Experiments (DOE) are the most efficient way to optimize and improve your process. But many of us find DOE intimidating, especially if it's not a tool we use often. How do you select an appropriate design, and ensure you've got the right number of factors and levels? And after you've gathered your data, how do you pick the right model for your analysis? One way to get started with DOE is the Assistant in Minitab Statistical Software.

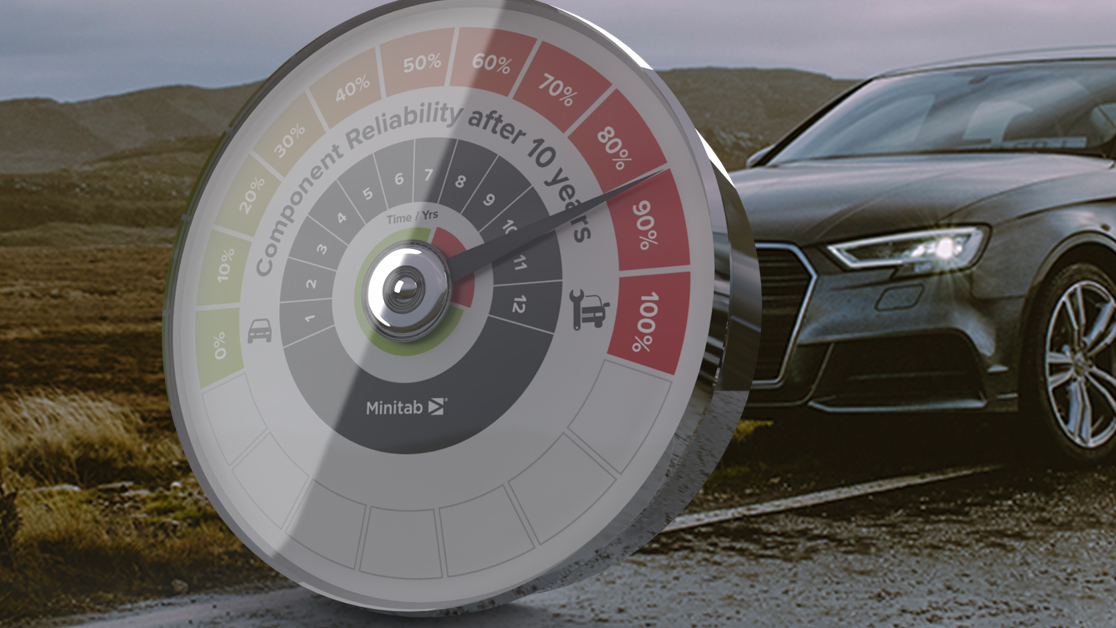
Reliability
In cases like equipment failure, the original equipment manufacturers (OEM) would be at fault. These OEMS must then quickly find the root cause and determine the risk for other vehicles still operating in field so they can predict how many additional vehicles will return with the same problem or continue driving with no problems at all (also called survivors). Eventually if the risk is high enough, a vehicle recall in that market could be necessary. Learn how one company predicted and prevented product failure.
Time Series
Modeling time series analysis requires different methods and comparisons of models. Always check accuracy measurements to see which model is minimizing the errors. It is also good practice to predict forecasts on data you currently have collected to confirm the best fitting model, before you make forecasts on unobserved data. Learn more in this blog.

Monte Carlo Simulation
Monte Carlo simulations have come a long way since they were initially applied in the 1940s, when scientists working on the atomic bomb calculated the probabilities of one fissioning uranium atom causing a fission reaction in another. Today, using Minitab’s solutions, you can simulate the range of possible outcomes to aid in decision-making, forecast financial results or estimate project timelines, understand the variability in a process or system, or manage risk by understanding cost/benefit relationships.

Powerful, Market-Leading, and Easy-to-Use Statistical Software
Knowing how to analyze data can be overwhelming. The good news is MinitabStatistical Software can analyze your data for you, so you can focus on what’s most important: Making great data-informed decisions.
Only Minitab provides comprehensive visualizations and analytics with the platform flexibility you need. Whether it’s an exploratory investigation into your data, an in-depth analysis, or a dashboard full of insights to share with your team, Minitab has the statistical methods you need to turn data into knowledge.
DID YOU KNOW?
OUR CUSTOMERS
Romario G.
Consultant
OUR CUSTOMERS
Travis B.
Quality Engineer
You are now leaving minitab.com.
Click Continue to proceed to: