You expect to find many lifesaving techniques in hospitals—expensive medical research, groundbreaking procedures—but when it comes to treating patients with cardiovascular disease, the approach one Taiwanese hospital used might surprise you: data analysis.
Heart disease is one of the leading causes of death in Taiwan, so it’s no wonder the country’s healthcare professionals are looking for ways to improve treatment options.
That’s why a Lean Six Sigma project team at Cathay General Hospital in the city of Taipei examined the emergent angioplasty process for treating patients suffering from acute ST-elevation myocardial infarction (STEMI), a heart attack caused by coronary heart disease. Improving aspects such as the wait time between diagnosis and treatment could help to save many lives.
Doctors and quality managers from the hospital’s Quality Management Center used Minitab Statistical Software to assess the hospital’s process and confidently re-engineer both the diagnosis and treatment processes while increasing savings in medical resources.
The Challenge
Patients with STEMI are diagnosed through electrocardiogram findings and cardiac markers, and the recommended course of treatment for these patients is angioplasty completed within 90 minutes of arrival.

A project team at Cathay General Hospital used Minitab Statistical Software to analyze data that would improve treatment for patients suffering from heart attacks. Above, the hospital is shown in its Taipei City, Taiwan, location.
Medical professionals refer to this period as the door-to-balloon (D2B) time, because angioplasty involves inserting a small balloon inside the blocked blood vessel with a catheter. When inflated at the site of the blockage, the balloon enables blood flow to resume.
To maximize the patients’ chances for survival, the team needed to evaluate each step of the process. They needed to identify which variables were responsible for a D2B time that exceeded the recommended treatment time, and, more importantly, what adjustments could be made to minimize it.
How Minitab Helped
The team analyzed D2B time—which includes an electrocardiogram, the wait time before the operation, and the time for balloon inflation—using Minitab Statistical Software.
However, you can only trust the results of an analysis if you trust the data you’re analyzing. To ensure the data were trustworthy, the project team used Minitab to conduct a Gage R&R Study of their measurement system. This method evaluates a system’s precision, including its repeatability and reproducibility to ensure that measurements are consistent and reliable.
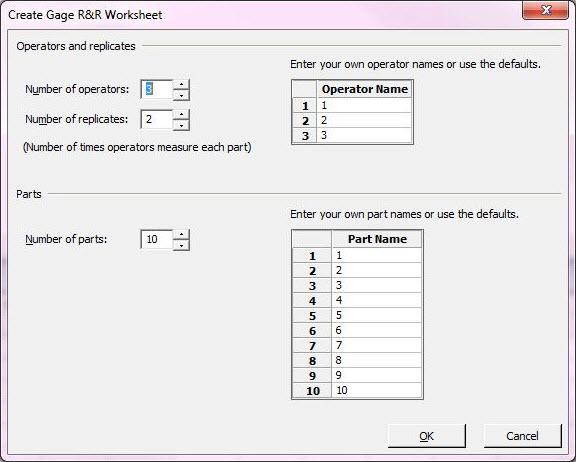
Minitab’s Assistant menu makes it easy to choose and use the right tool, even if you’re not a statistician. The dialog box above helps users create a data collection worksheet for a Gage R&R study.
Once they verified the precision of their measurements, the team analyzed D2B data from 40 STEMI cases that occurred over a nine-month period.
First, they tested the data to see if it followed a normal distribution, which is a key assumption in many types of analysis. The data were not normally distributed, but using Minitab the team easily applied a Box-Cox transformation to normalize it. The team then used the transformed data to create an I-MR control chart to evaluate if their process was stable over time. This type of control chart plots both individual observations (I) and the moving ranges (MR) to show how the mean and variation in the observations change over time.
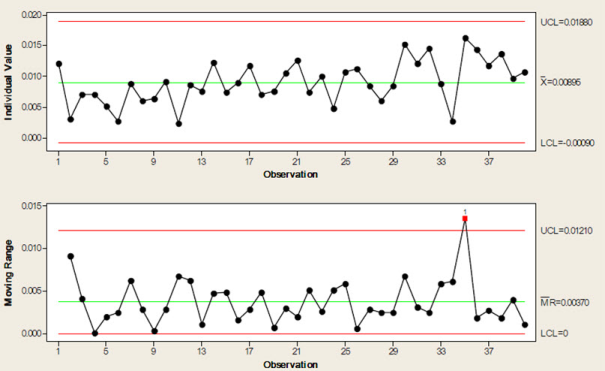
The I-MR control chart above displays the normalized data from the Box-Cox transformation and identifies unusual sources of variation in the data.
The project team also used Minitab to conduct a process capability analysis to determine whether their process met performance specifications and provide insight into how they might improve their process. In this case, the upper specification limit for D2B time was 90 minutes. The results of the capability analysis confirmed that the hospital’s handling of STEMI cases had significant room for process improvement.
The team examined each step in handling a STEMI patient and identified several areas in which efficiency could be significantly enhanced, including confirming the diagnosis, medicating the patient, preparing for the operation, transferring the patient to the catheterization laboratory, and inflating the balloon.
Results
After assessing the STEMI process, the team implemented improvements such as sending patients who arrive with chest pain directly to an electrocardiogram test, printing treatment sheets automatically as opposed to writing them by hand, making a STEMI medication pack available in the emergency department, contacting the catheterization staff upon diagnosis confirmation, prepackaging all STEMI operation equipment in one box, and discontinuing the use of operation time as a forum to teach staff members who are not familiar with the procedure.
The team then collected additional data and reevaluated the process. Using Minitab to analyze the new data, the team demonstrated that the average D2B time dropped from 139.2 to 57.9 minutes—a 58.4% improvement. Furthermore, capability analysis showed that this new process could meet specifications.
A more efficient process means patients receive angioplasty more quickly, which saves lives. Moreover, the average hospital stay for STEMI patients has decreased by three days since the new process was implemented, and the hospital has saved $4.4 million in medical resources. The project was recognized by the Taiwan Joint Commission of Hospital Accreditation, and was awarded the Symbol of National Quality by the Institute for Biotechnology and Medicine Industry.
Applying data analysis and Lean Six Sigma methods to the health care system doesn’t grab headlines like an experimental surgery might. But as more hospitals use data analysis to make procedures better, faster, and safer, its benefits will be seen every day in the faces of patients whose lives are saved.

Organization
Cathay General Hospital
Overview
- Teaching hospital located in city of Taipei, Taiwan
- Has provided quality healthcare to northern Taiwan for over 30 years
- Provide comprehensive services including major cardiac, neurological, and transplantation surgeries
- Operates 778 patient beds
- Part of a healthcare network that also includes branches in the Hsinchu and Sijhih areas, and a clinic in Neihu
Challenge
Evaluate the hospital’s process for heart attack patients in order to improve the wait time between diagnosis and treatment to save lives, as well as optimize efficiency, eliminate waste, and reduce the cost of medical resources.
Products Used
Minitab® Statistical Software
Results
- Used data analysis to improve treatment for heart attack patients
- Decreased heart attack patients’ hospital stay
- Introduced a new patient process that saved $4.4 million in medical resources
- Improved the average wait time between diagnosis and treatment by 58.4%